The 20-period Exponential Moving Average (EMA20) is a highly valued and frequently used tool in technical analysis, particularly for traders focused on capturing short-term market movements and swings. Unlike the Simple Moving Average (SMA), which averages all price data equally, the EMA is a weighted moving average that gives greater emphasis to the most recent prices. This weighting makes the EMA, and specifically the 20 EMA, more responsive and quicker to react to current market shifts compared to the SMA, providing a faster-moving trend indicator.
The 20 EMA represents the average closing price of the last 20 periods, adjusted to reflect the significance of recent price action. Its focus on recent data makes it effective for identifying market trends and movements and is often used to gauge pullbacks and continuation patterns.
Core Functionality and Trend Identification
The primary uses of the EMA20 revolve around identifying the prevailing market trend and locating potential support and resistance levels.
Trend Direction
The relationship between the stock price and the 20 EMA signals the market direction:
• Uptrend (Bullish): If the price stays consistently above the 20 EMA and the line is sloping upward, it signals a bullish trend, suggesting potential buying opportunities.
• Downtrend (Bearish): If the price remains consistently below the 20 EMA and the line is pointing downward, it signals a bearish trend, suggesting potential selling opportunities.
• Consolidation (Ranging): A flat EMA suggests the market is ranging or consolidating, a time when trend-following strategies may be ineffective.
Dynamic Support and Resistance
The 20 EMA often acts as a dynamic support or resistance level in trending markets.
• In an uptrend, the EMA can serve as support, where the price frequently bounces back up, offering buy opportunities.
• In a downtrend, the EMA acts as resistance, potentially preventing breakouts and signaling selling pressure. Traders expect the price to reverse at these moving average levels, which creates a self-fulfilling prophecy leading to potential entry or exit points.
Popular Trading Strategies Using EMA20
The 20 EMA is a versatile indicator, particularly favored by swing traders who use timeframes such as 1-hour to 4-hour charts. Several effective strategies rely on the 20 EMA:
1. EMA Pullback Entry Strategy
This strategy capitalizes on the fact that trends rarely move in a straight line; they pull back before continuing.
- Identify the Trend: Use the 20 EMA to determine the prevailing trend.
- Wait for Pullback: Wait for the price to dip back or “pull back” to the 20 EMA line.
- Confirm Entry: Look for confirmation (like a bullish candlestick pattern or a bounce) to enter the trade in the direction of the underlying trend. This strategy is useful for finding clean, low-risk entries because entering a trade close to the 20 EMA minimizes the stop loss and risk. For intraday trading, this method helps identify good entry points by waiting for the price to test the support/resistance level provided by the 20 EMA.
2. EMA Crossover Strategies
Crossover strategies involve combining the 20 EMA with other moving averages (MAs) of different lengths to identify trend changes or new trends. A crossover of a shorter-term MA above a longer-term MA is generally bullish, while a cross below is bearish.
| Strategy | Components | Best For | Signal Summary |
| 9/20 EMA | 9-period EMA (fast) and 20-period EMA (slow). | Scalping and intraday trading. | 9 EMA crossing above 20 EMA is a buy signal. |
| 5/20 EMA | 5-period EMA (very fast) and 20-period EMA. | Aggressive scalping in high volatility. | Crossover points determine buy or sell signals. |
| 20/60 EMA | 20-period EMA (fast) and 60-period EMA (long-term filter). | Swing and long-term trading. | 20 EMA crossing above 60 EMA is a bullish signal. |
| 20/200 EMA | 20-period EMA and 200-period EMA (long-term trend). | Position trading. | 20 EMA crossing above 200 EMA may indicate the beginning of a long-term bullish trend. |
3. 20 EMA High and Low Strategy
This specific, high-probability approach uses two distinct EMA indicators to define price boundaries and confirm momentum:
- 20 EMA High: Tracks the upper boundary of price movement (often green).
- 20 EMA Low: Acts as the lower boundary of price movement (often red).
Trading Rules for the 20 EMA High & Low Strategy:
- Trend Signal: Only take long trades if the price is above the 20 EMA High (green line), signaling strong bullish momentum. Only take short trades if the price is below the 20 EMA Low (red line), indicating bearish strength.
- Confirmation: Wait for the confirmation candle.
◦ For a long trade (price above 20 EMA High), the next candle should be bullish (green).
◦ For a short trade (price below 20 EMA Low), the next candle should be bearish (red). - Entry and Retest: Traders have two entry options:
◦ Enter immediately upon the formation of the confirmation candle.
◦ Wait for a retest: The market often retests key levels before a bigger move. For a long trade, wait for the price to pull back to the 20 EMA Low (red line) and find support. For a short trade, look for sell entries near the 20 EMA High (green line), which acts as strong resistance. - Stop-Loss Placement: A safe stop-loss placement is usually slightly below the 20 EMA Low (red line), ensuring a good risk-reward setup.
- Profit Taking: Secure profits when reversal signs are spotted, or when the market gives you money, as hesitating risks giving the gains back
Enhancing 20 EMA Strategies with Confirmation Tools
The EMA, despite its responsiveness, is a lagging indicator and should not be used alone. Combining the 20 EMA with other tools helps enhance accuracy and filter out false signals.
| Combined Indicator | Role in Confirmation |
| Relative Strength Index (RSI) | RSI gauges the speed of price change and identifies overbought or oversold levels. For a high-probability trade, look for the price to close above the 20 EMA after the RSI has signaled an oversold condition (for a buy trade). A rising price above the EMA combined with RSI rising from oversold levels suggests a strong buy signal. |
| Moving Average Convergence Divergence (MACD) | MACD is based on EMAs and helps confirm momentum shifts. MACD crossovers, combined with the 20 EMA trend direction, can signal high-probability entries. |
| Candlestick Patterns | Candlestick patterns (like bullish engulfing or hammer) become more significant when they occur near the EMA line, which is acting as dynamic support or resistance, adding confidence to the trade. |
Illustrating EMA20 Trading: Gamuda
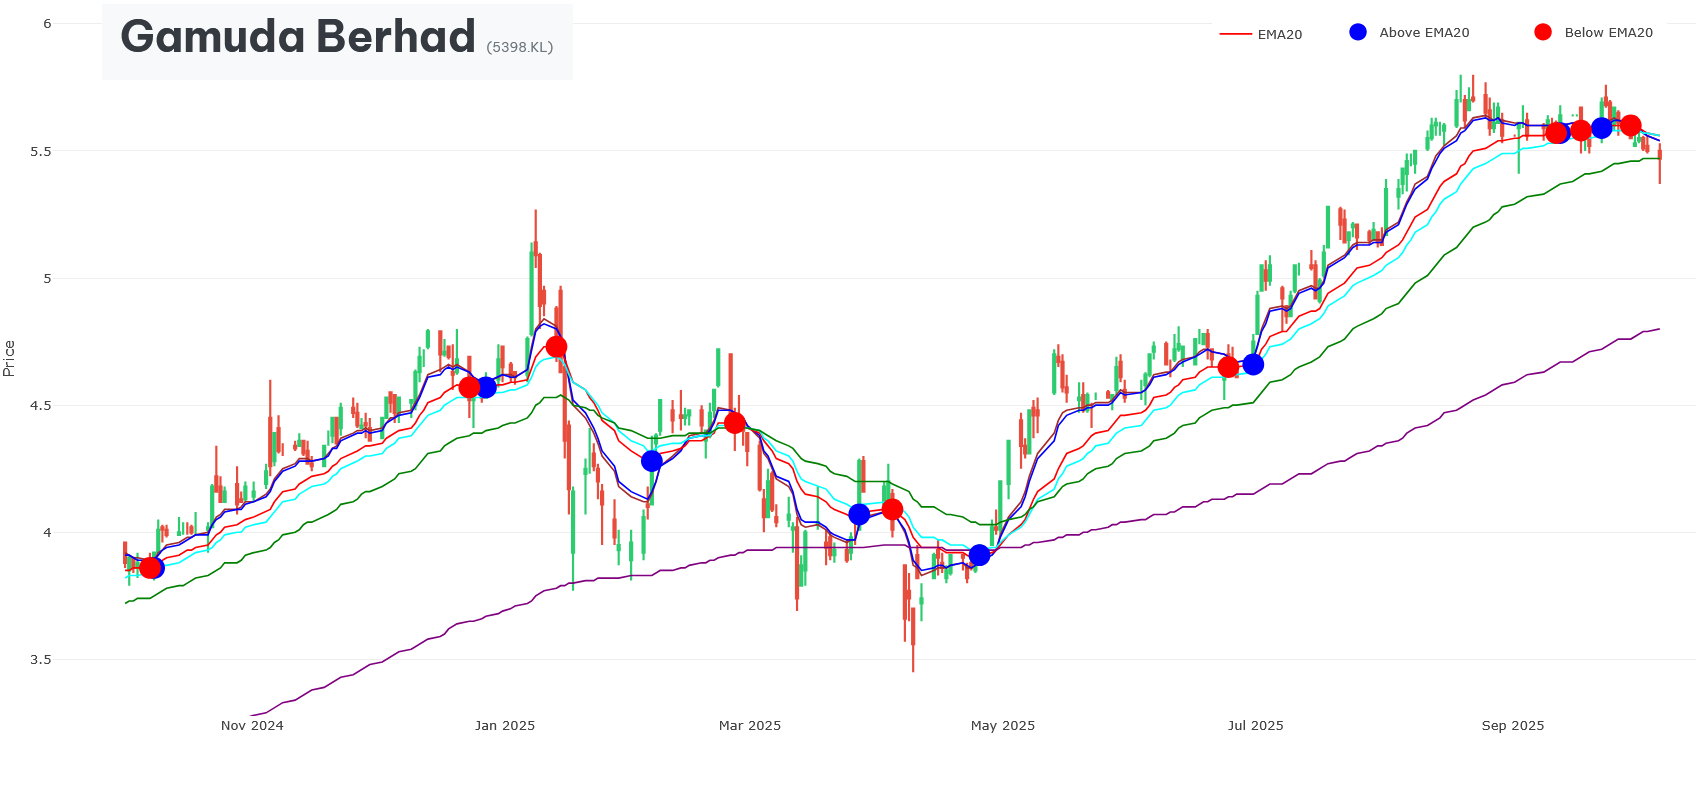
1. Trend Identification and Maintenance (The Trend Filter)
The EMA20 serves as a crucial trend filter, indicating whether traders should look for buy-only or sell-only setups. If the price is consistently above the EMA and the line is sloping upward, it signals a bullish tren
Example of a Strong Uptrend (October – Mid-December 2024):
• Following a confirmed crossover above the EMA20 on October 8, 2024 (Close: 3.915 vs. EMA20: 3.861), the price enters a sustained uptrend.
• Throughout October and November, the price largely remains comfortably above the EMA20, such as on November 6, 2024 (Close: 4.385 vs. EMA20: 4.121), and December 13, 2024 (Close: 4.787 vs. EMA20: 4.510).
• During this period, the EMA20 is sloping upward, suggesting that traders should focus only on buy trades.
Example of a Strong Downtrend (Mid-January – Early February 2025):
• After the price falls below the EMA20 on January 13, 2025 (Close: 4.694 vs. EMA20: 4.726), a sustained downtrend begins.
• The price remains consistently below the EMA20 for several weeks, such as on January 24, 2025 (Close: 4.106 vs. EMA20: 4.441).
• The EMA20 acts as dynamic resistance above the price. In this phase, traders would shift their focus exclusively to sell trades (short-only setups).
2. Crossover Signals (Entry/Exit Triggers)
A price crossover, where the price moves across the EMA20 line, can signal a potential trend reversal or continuation.
Example of a Bullish Crossover (October 8, 2024):
• On October 7, 2024, the price momentarily dipped below the EMA20 (Close: 3.846 vs. EMA20: 3.856), triggering a Cross_Below_EMA20 signal.
• The very next day, October 8, 2024, the price closed at 3.915, moving significantly above the EMA20 (3.861). This bullish crossover (where the price moves above the moving average) provides a potential buy signal, indicating upside momentum.
Example of a Bearish Crossover (September 11, 2025):
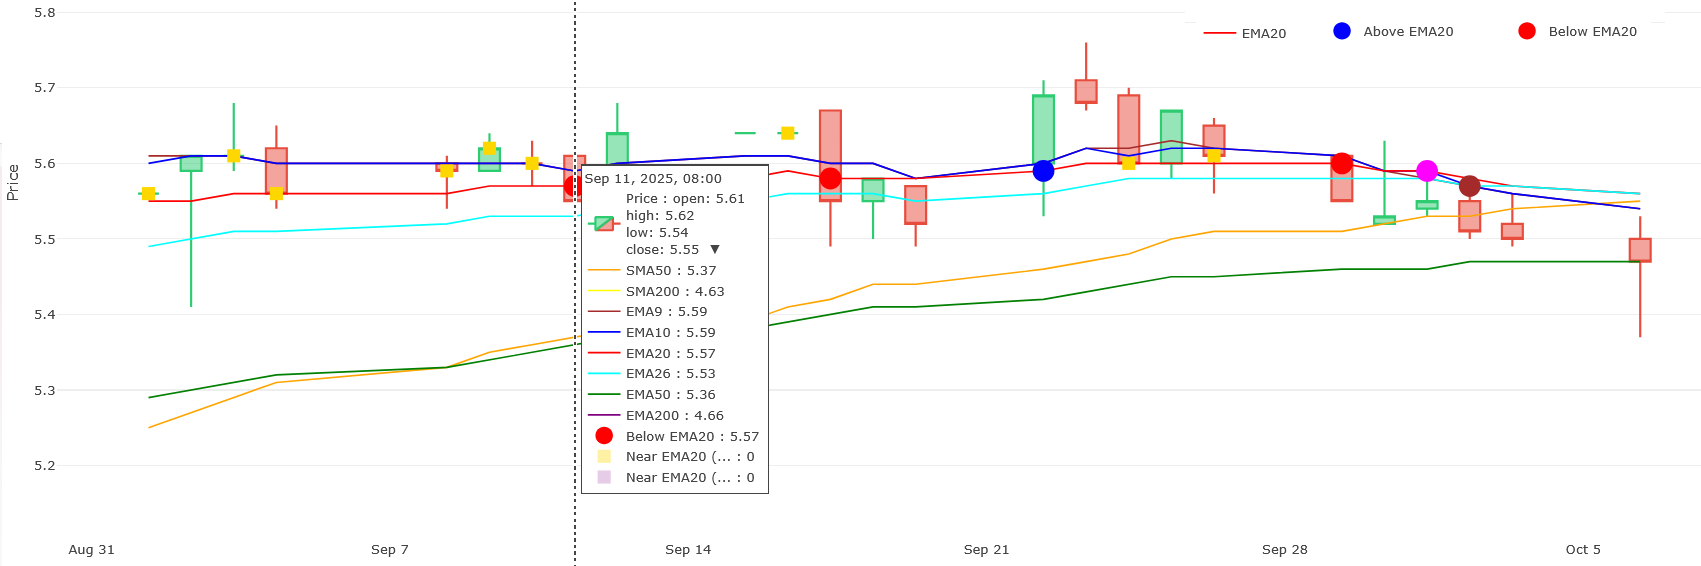
• On September 11, 2025, the close price (5.550) drops below the EMA20 (5.567), triggering a Cross_Below_EMA20 signal.
• This bearish crossover, where the price drops below the EMA, suggests a possible shift toward a downtrend or a deep pullback.
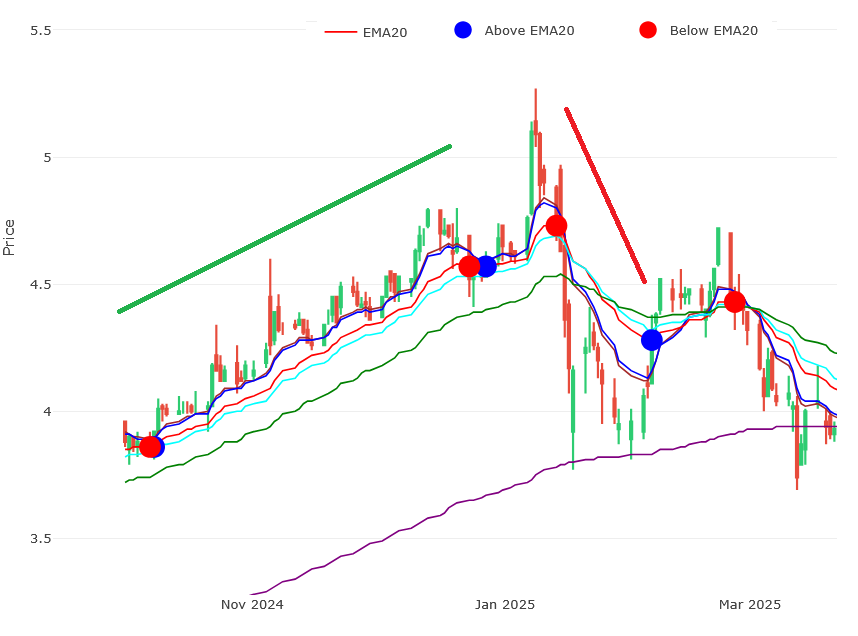
3. EMA Pullback Entry Strategy
The pullback strategy involves waiting for the price to retreat to the EMA line before continuing in the primary direction. Entering a trade close to the EMA line helps minimize the stop loss and risk, as the EMA often acts as dynamic support/resistance.
Example of a Bullish Pullback Entry (December 2024/January 2025):
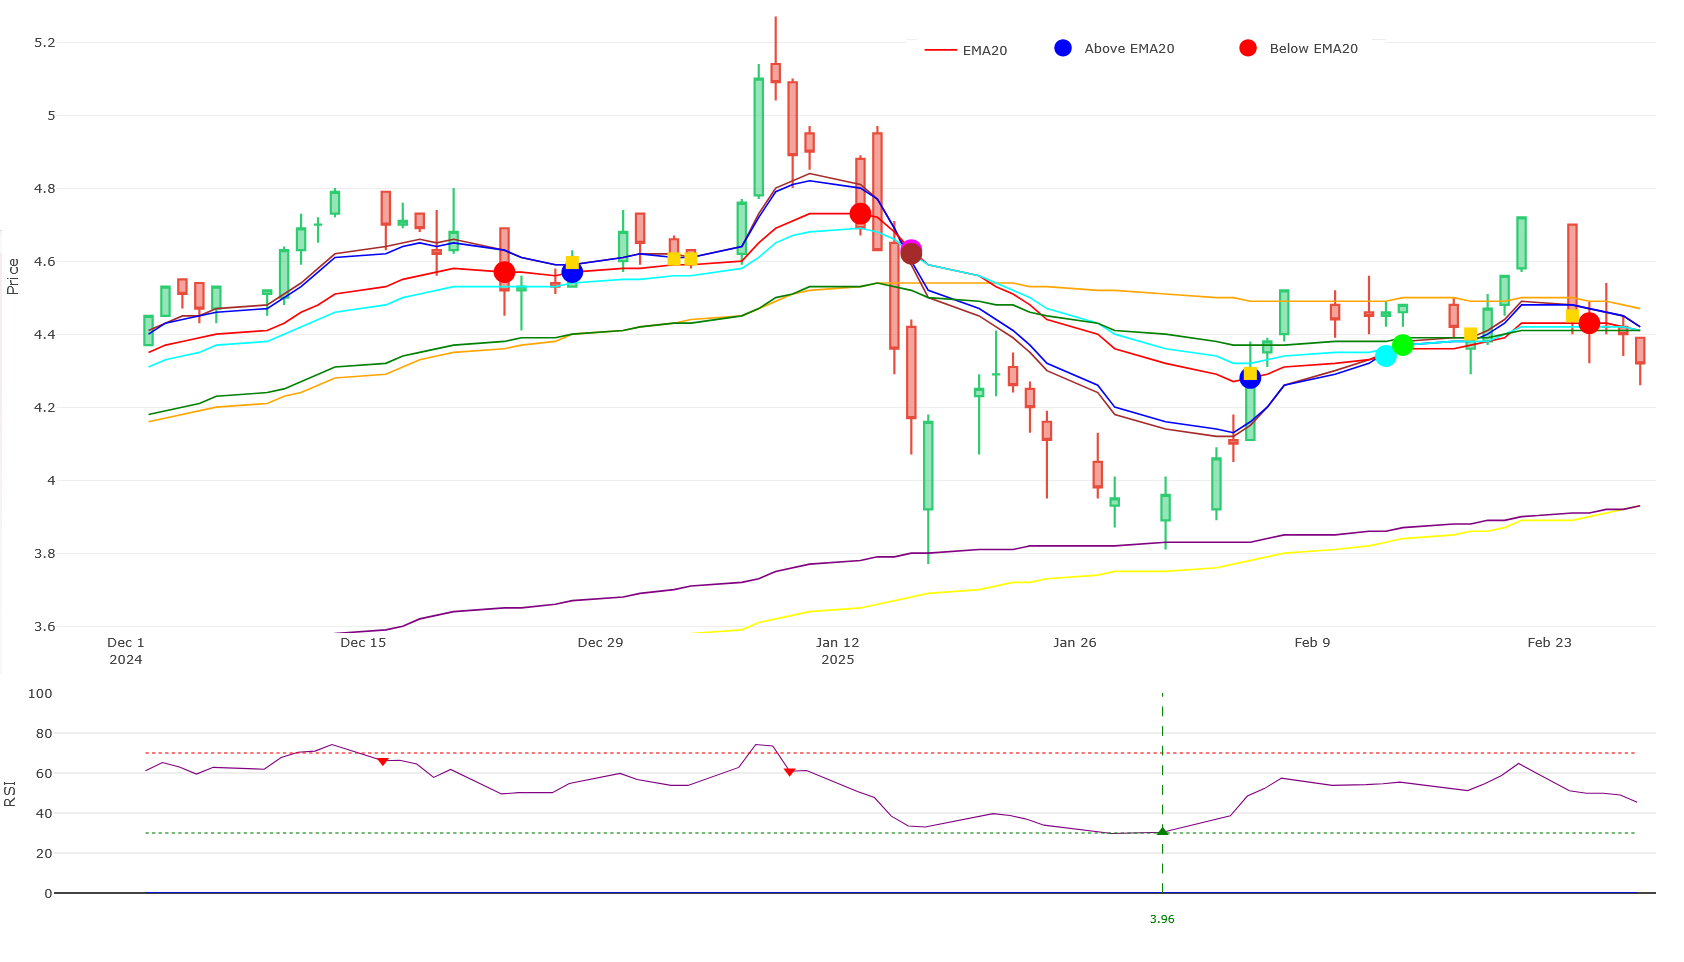
1. Initial Trend: The market was in a strong uptrend through mid-December.
2. Pullback: By December 23, 2024, the price falls below the EMA20. This pullback tests the previous support level provided by the EMA20.
3. Bounce Confirmation: On December 27, 2024, the price closes above the EMA20 (Close: 4.596 vs. EMA20: 4.566), generating a Cross_Above_EMA20 signal. This bounce off the area of the EMA provides a clean, low-risk entry point for a long trade, expecting the original uptrend to resume.
4. Combining EMA20 with RSI for Confirmation: The EMA alone is a lagging indicator and should be combined with other tools to filter out false signals and enhance accuracy. The Relative Strength Index (RSI) identifies overbought (RSI typically above 70) or oversold (RSI typically below 30) levels.
Example of a High-Probability Reversal Entry (February 2025):
1. Oversold Condition: Throughout late January 2025, the price was in a deep downtrend, and the RSI was significantly low, dipping to 29.76 on January 28. This indicates the market is nearing oversold levels, suggesting buyers might step in.
2. Crossover Confirmation: On February 5, 2025, the price closed above the EMA20 (Close: 4.292 vs. EMA20: 4.275), triggering a Cross_Above_EMA20 signal.
3. Entry Signal: The combination of the price closing above the EMA20 after the RSI signaled a potential oversold condition creates a strong, high-probability buy signal, confirming momentum is shifting upward.
Example of Continuation of Strong Momentum (May 2025):
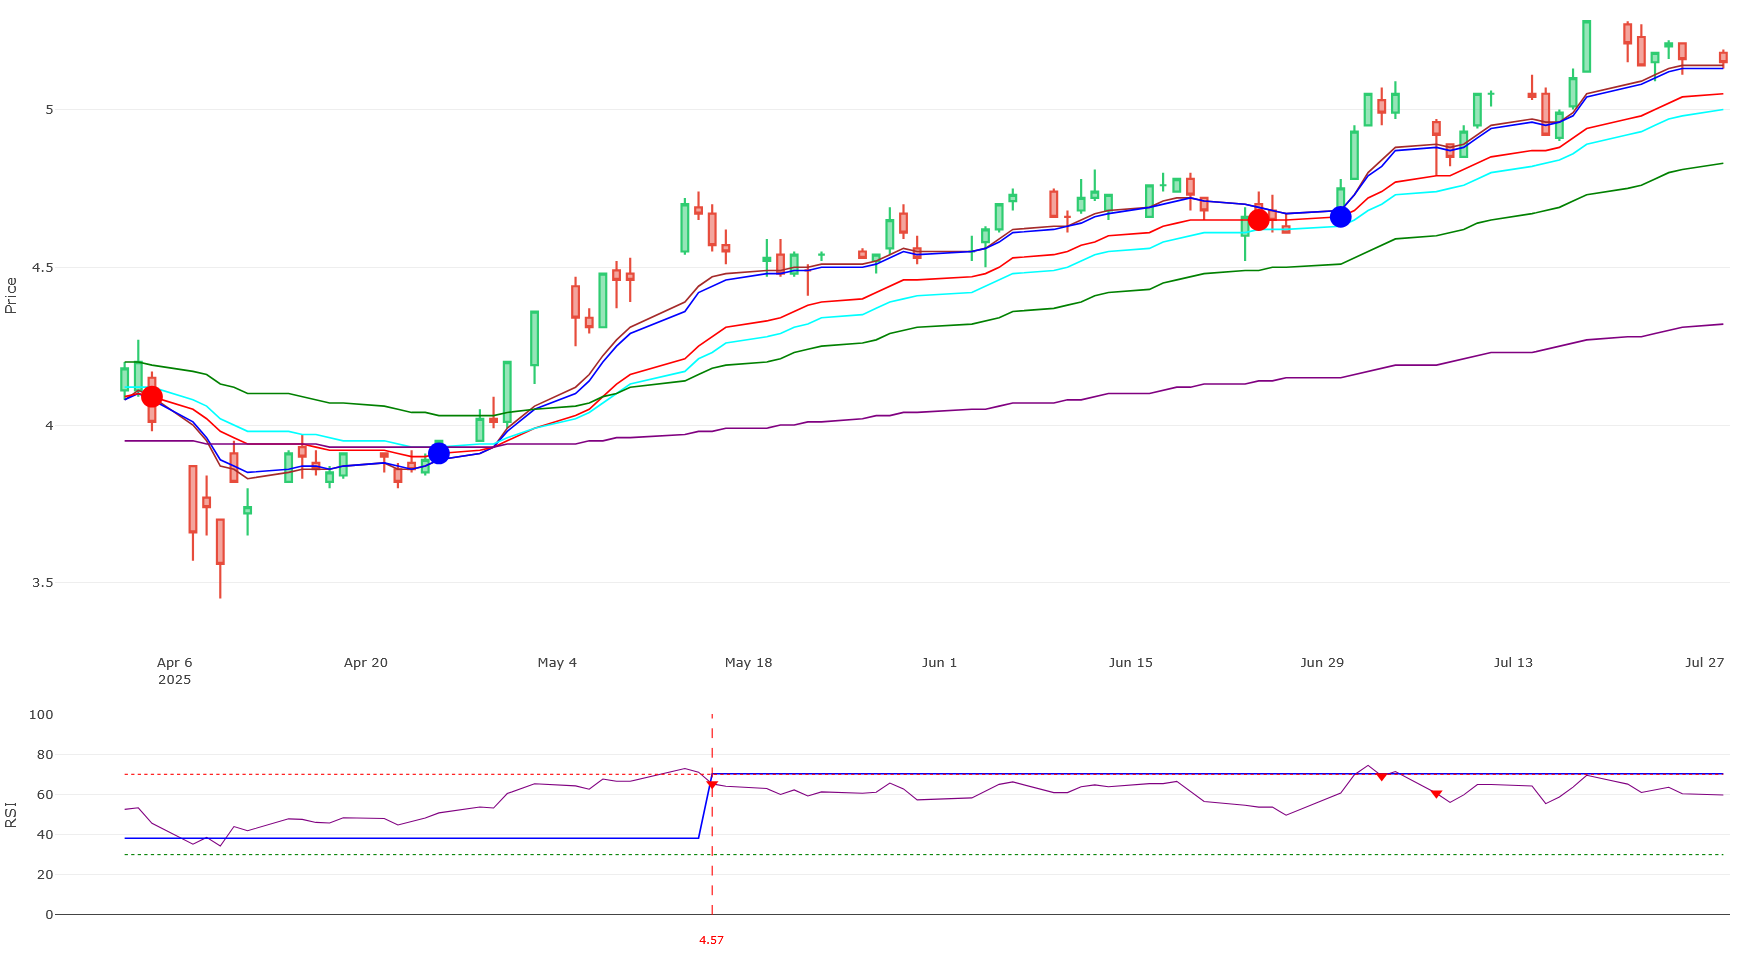
• By May 2, 2025, the price is far above the EMA20 (Close: 4.360 vs. EMA20: 3.992).
• The RSI is at 65.29. Although not yet overbought, this high RSI combined with the price being far from the EMA suggests strong bullish momentum. According to the principles of the 20 EMA High & Low strategy, entering far from the EMA line is considered a risky entry because the stop loss would be wider. The wise trader would likely wait for a retest near the EMA20 before entering.
Advantages and Disadvantages of the 20 EMA
The 20 EMA is recognized for its utility but, like all indicators, has limitations.
| Advantages of EMA | Disadvantages of EMA |
| Faster Response: Quicker to detect trend shifts than the SMA because it weights recent prices more heavily. | Lagging Indicator: Still relies on past prices and does not predict future movements. |
| Ideal for Short-Term Trading: Its sensitivity makes it useful for short-term momentum and swing traders. | False Signals/Whipsaws: Can produce false signals in choppy or sideways markets, reacting to random price noise |
| Smooths Noise: Filters out minor price fluctuations to show a clearer trend direction. | Over-Sensitivity: In highly volatile conditions, EMAs may lead to premature exits. |
| Dynamic S/R: Helps identify dynamic support and resistance levels that prices often respect. | Requires Confirmation: Signals are stronger when confirmed by other technical indicators. |
By understanding these characteristics and utilizing the 20 EMA with discipline, patience, and proper risk management (such as setting stop-losses just below key dynamic levels), traders can maximize potential profits and maintain capital over the long run.