Welcome to Stock-lah.com! Our platform is designed to empower your investment decisions with data-driven insights, all in one place. This guide will walk you through the key features and how to use them effectively.
Our Philosophy: Guidance Over Guesswork
Investing can be emotional. Stock-lah.com aims to replace that emotion with structured analysis. We provide real-time alerts, back-tested strategy performance, and consolidated fundamental data to help you make informed, disciplined decisions on whether to buy or sell a stock.
A) The Homepage: Your Stock Monitoring Dashboard
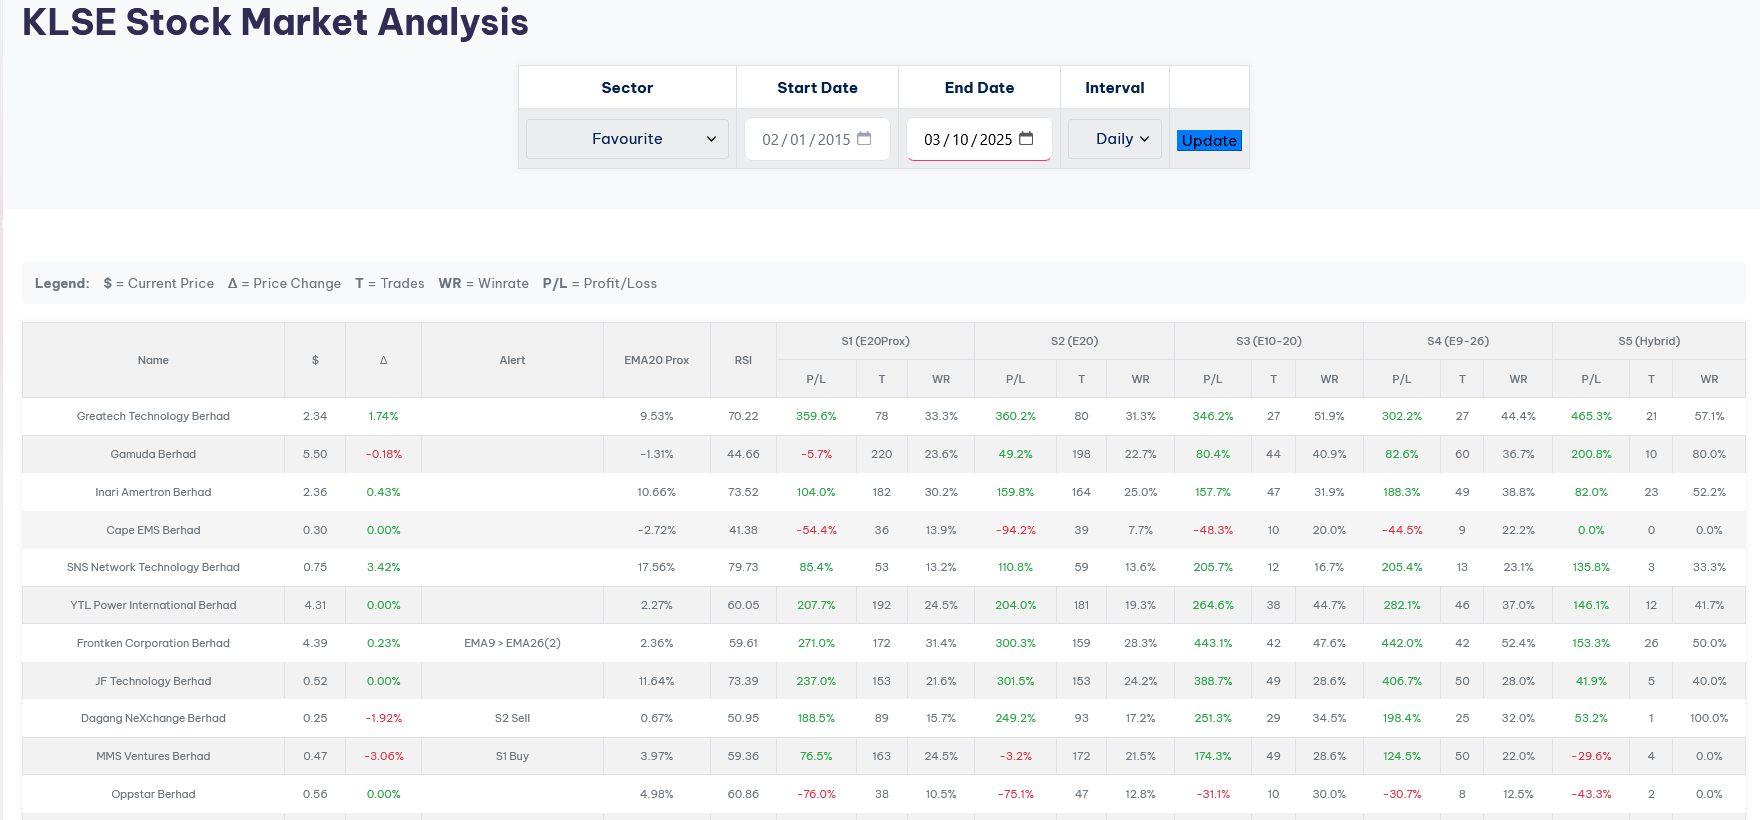
The homepage provides a real-time summary of all tracked stocks, allowing you to quickly scan for opportunities.
Understanding the Table Columns:
- Latest Price & Daily Difference: The current stock price and its net change for the day.
- Alert: This column is your signal. It shows if any of our five core strategies have been triggered for a stock. Instead of constantly monitoring charts, you can simply wait for an alert to appear here, then click on the stock for a deep dive.
- EMA20 Proximity: Shows how close the current price is to the 20-day Exponential Moving Average (EMA), displayed as a percentage. This helps gauge short-term momentum and potential support/resistance levels.
- RSI: The Relative Strength Index value indicates whether a stock is potentially overbought (typically above 70) or oversold (typically below 30).
- Strategy Performance (S1 to S5): This is the core of our back-testing. For each stock, we show how five distinct trading strategies would have performed since the year 2000. For each strategy, you see:
- P/L: The total profit or loss.
- Trades: The number of trades generated.
- Win Rate: The percentage of trades that were profitable.
How to Use the Homepage:
- Identify Opportunities: Use the Alert column to spot active trading signals.
- Evaluate Strategy Fit: See which strategies have historically worked well (or poorly) for a specific stock. This helps you decide if a current alert is one you should follow. Some strategies excel with certain stocks and fail with others.
- Avoid Poor Performers: If a stock shows consistently negative results across all five strategies historically, it may be one to approach with caution or avoid.
B) Stock Detailed Page: Your All-in-One Analysis Hub
When you click on a stock from the homepage, you land on its detailed page, which consolidates everything you need for a thorough analysis.
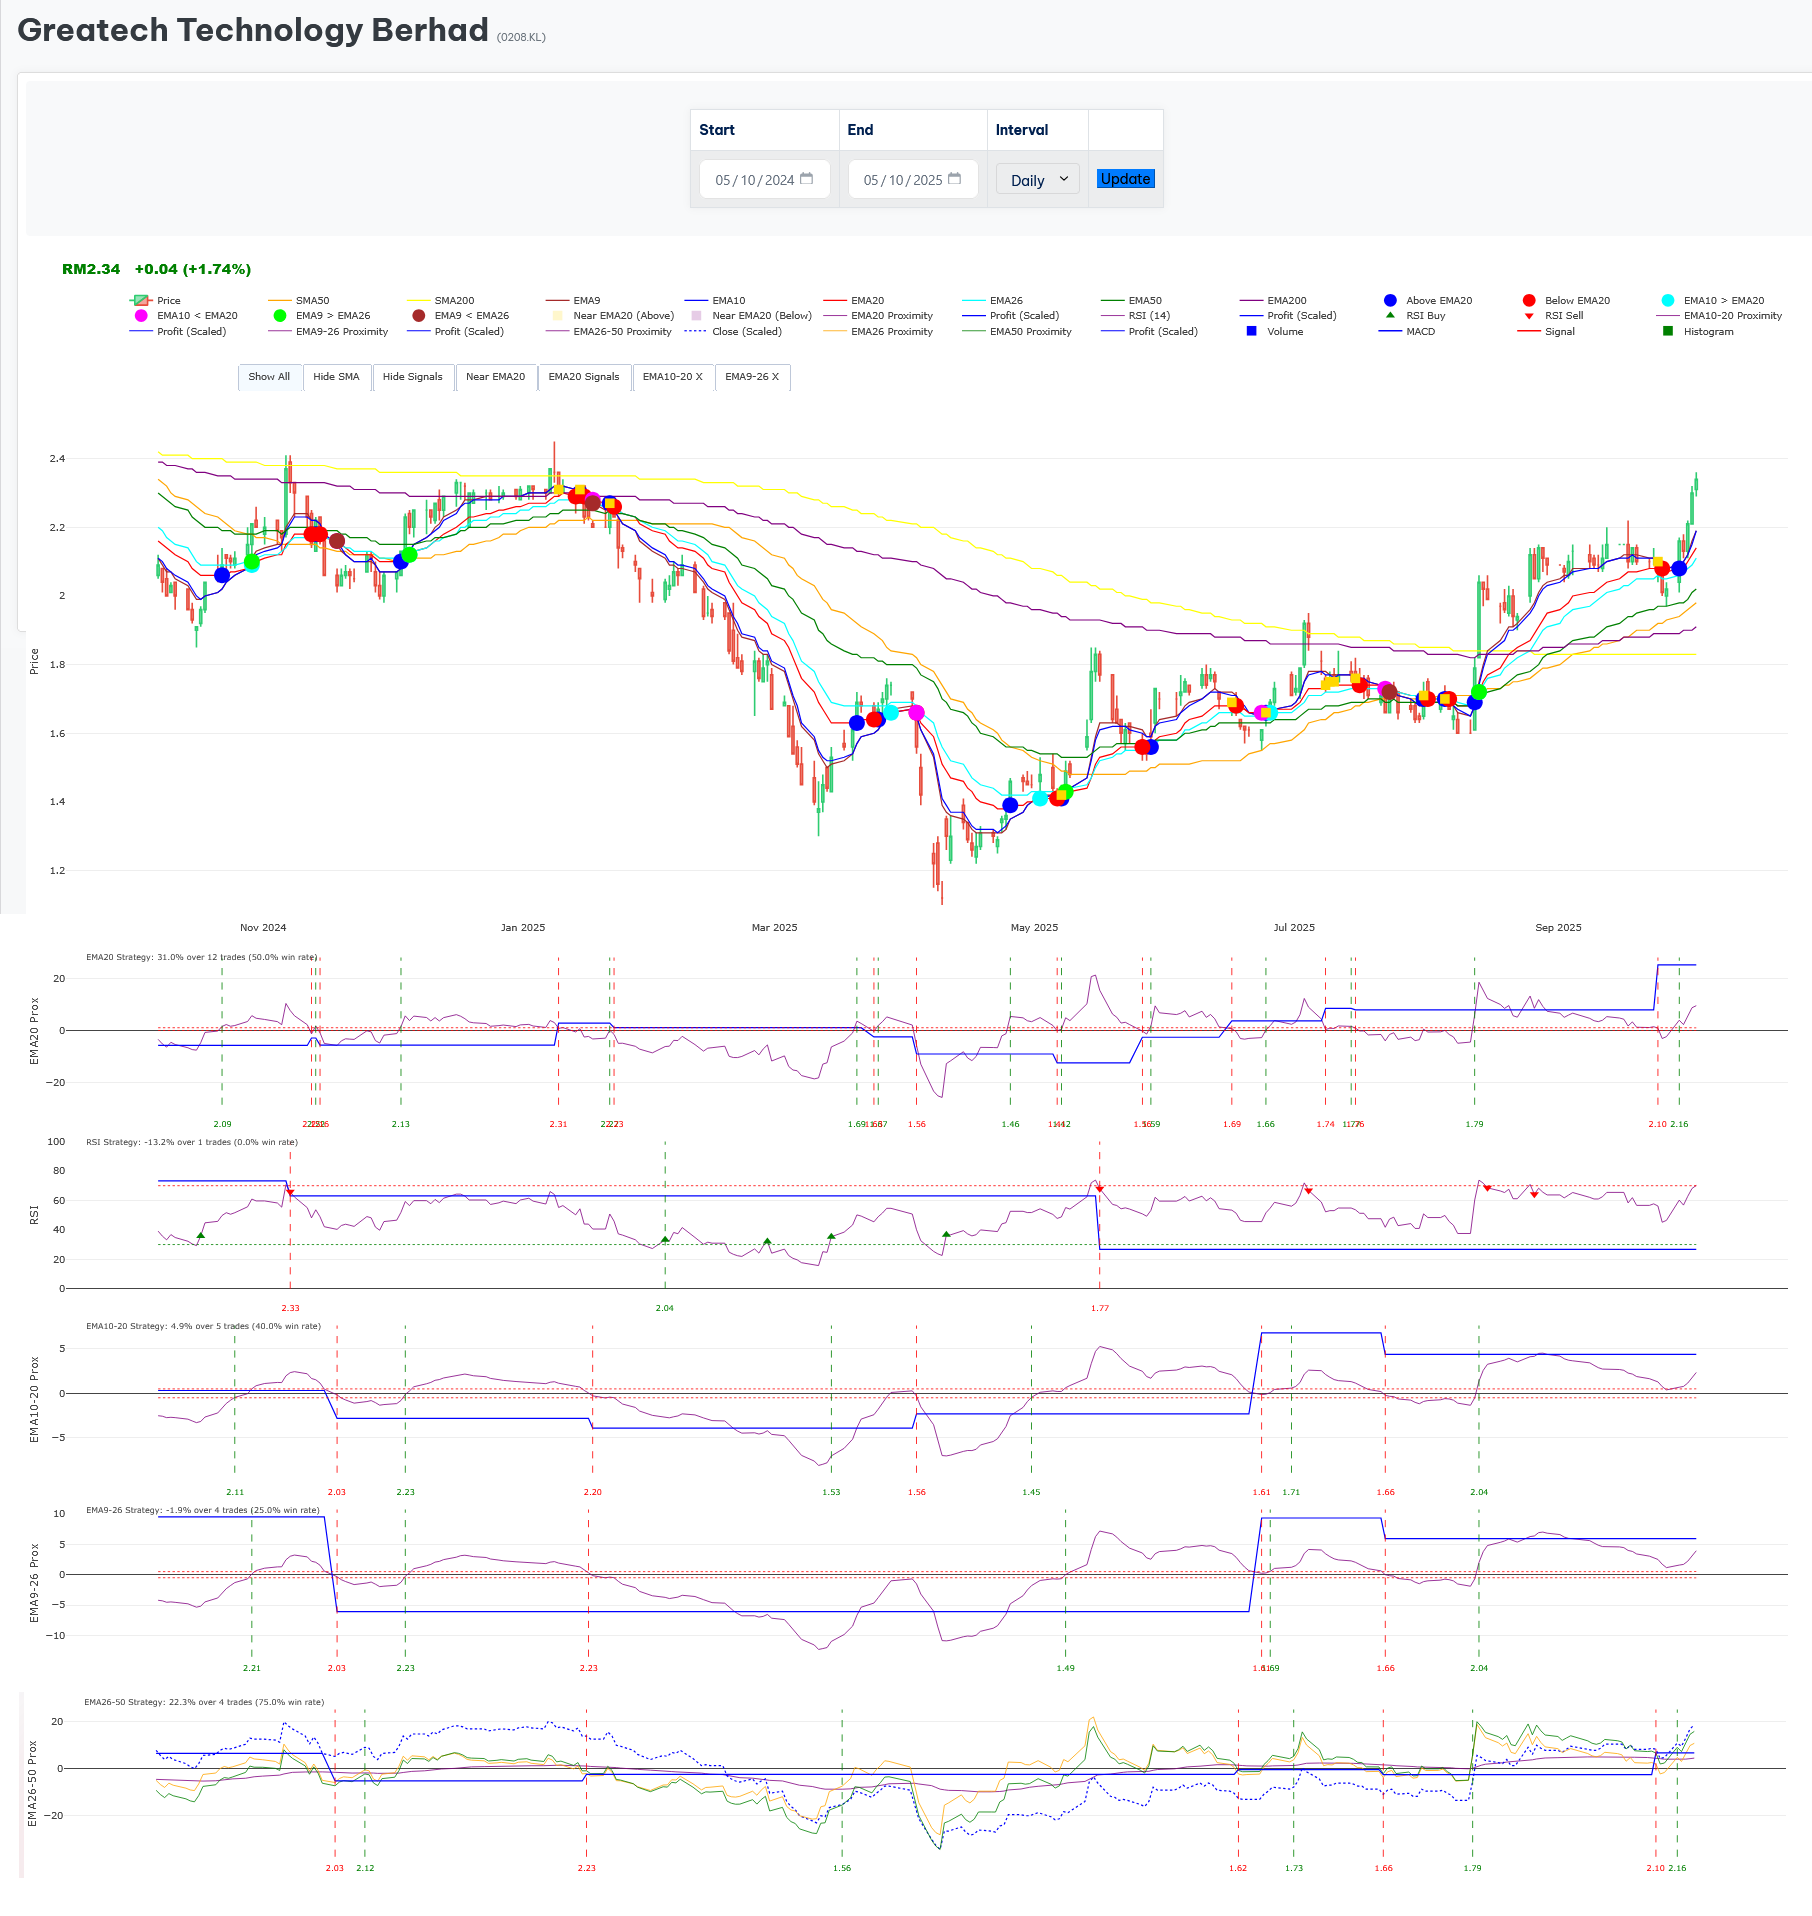
What You Will Find:
- Interactive Charts: View price charts with key technical indicators like EMAs, RSIs, SMAs, and MACD overlaid.
- Strategy Breakdown Charts: For each of the five strategies, see a dedicated chart that visually displays the exact Buy and Sell points (marked with green and red vertical lines), the profit/loss trajectory, and entry/exit prices.
- Company Fundamentals: Access essential financial data, including quarterly revenue and Earnings Per Share (EPS) trends.
- EPF Trading Activity: If available, see the recent buying and selling activity of the Malaysian Employees Provident Fund (EPF) for this stock.
- Analyst Target Prices: Review compiled target prices from various investment firms and analysts.
How to Use the Detailed Page:
This page is designed for your final decision-making. When an alert brings you here, you can:
- Verify the Signal: Check the strategy chart that triggered the alert to see the historical context of its buy signals.
- Assess Overall Health: Look at the fundamental data and other technical indicators to ensure the signal is supported by the company’s performance.
- Get the Big Picture: Combine insights from EPF activity and analyst targets with the algorithmic signals to build a comprehensive view before executing a trade.
C) Earnings+ Page: Find Post-Earnings Momentum
URL: https://stock-lah.com/earnings/
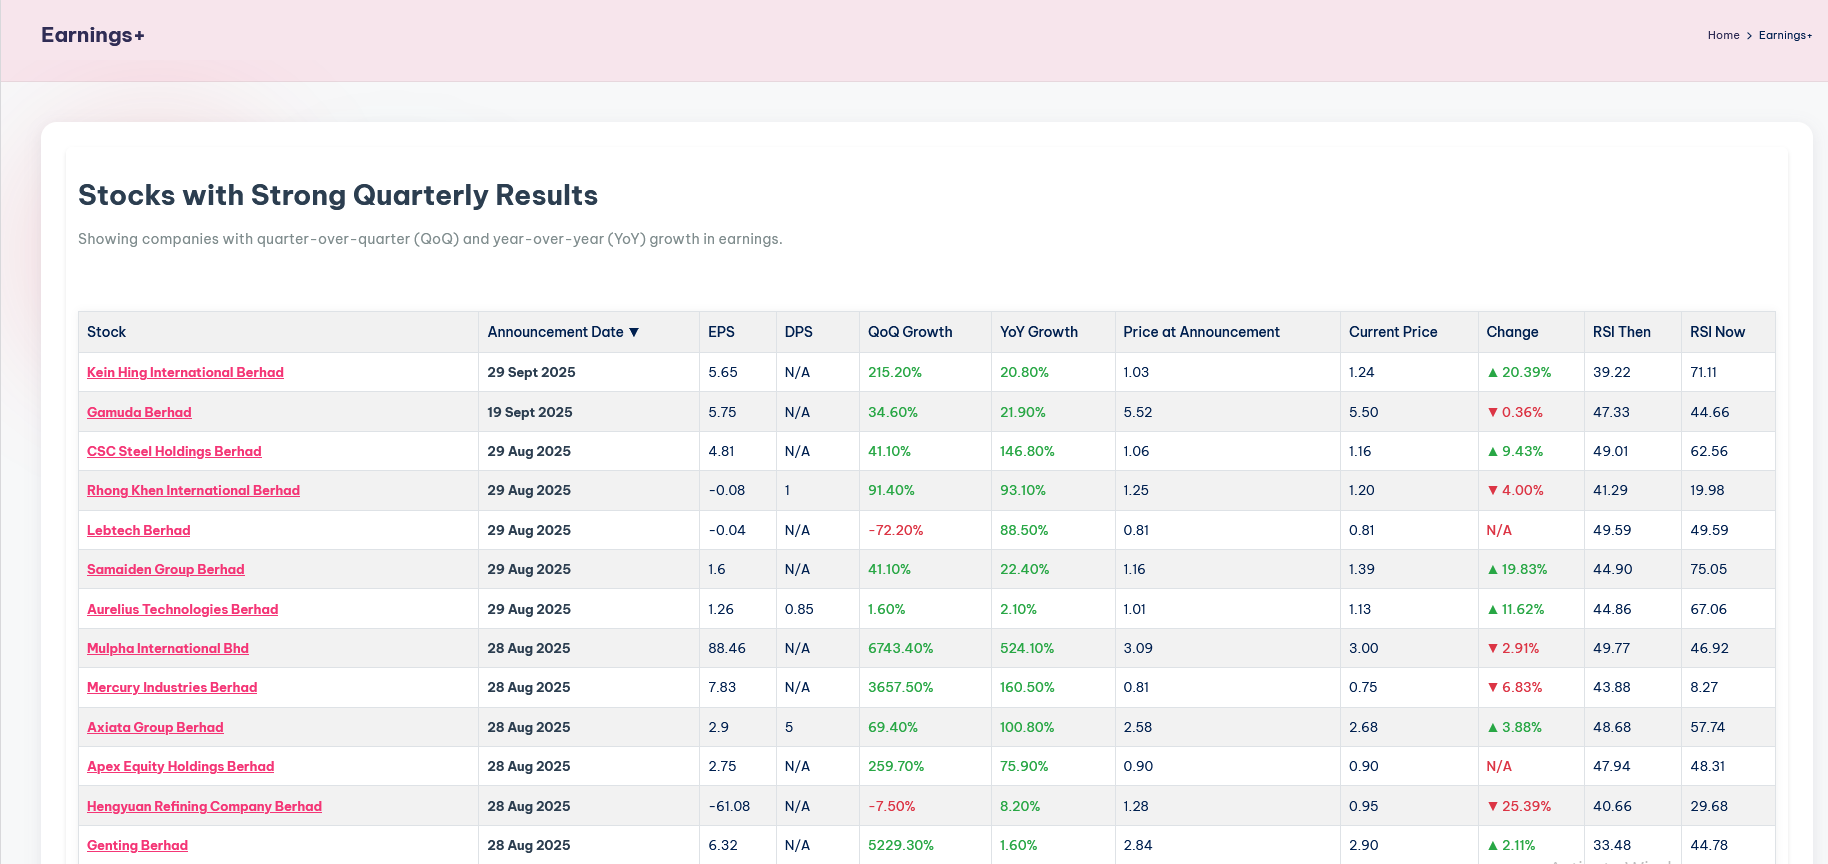
This page helps you discover companies that have recently reported strong earnings and may be poised for a price increase.
How it Works:
The table filters for companies showing positive Year-over-Year (YoY) revenue growth. It then cross-references this fundamental strength with a technical filter (RSI value) to identify stocks that may not have become overbought yet.
The Goal: To find a correlation between strong quarterly earnings, a reasonable RSI, and subsequent price appreciation, giving you a potential list of stocks to target after their reports are announced.
D) EPF Tracker Page: Follow the Smart Money
URL: https://stock-lah.com/epf-tracker/
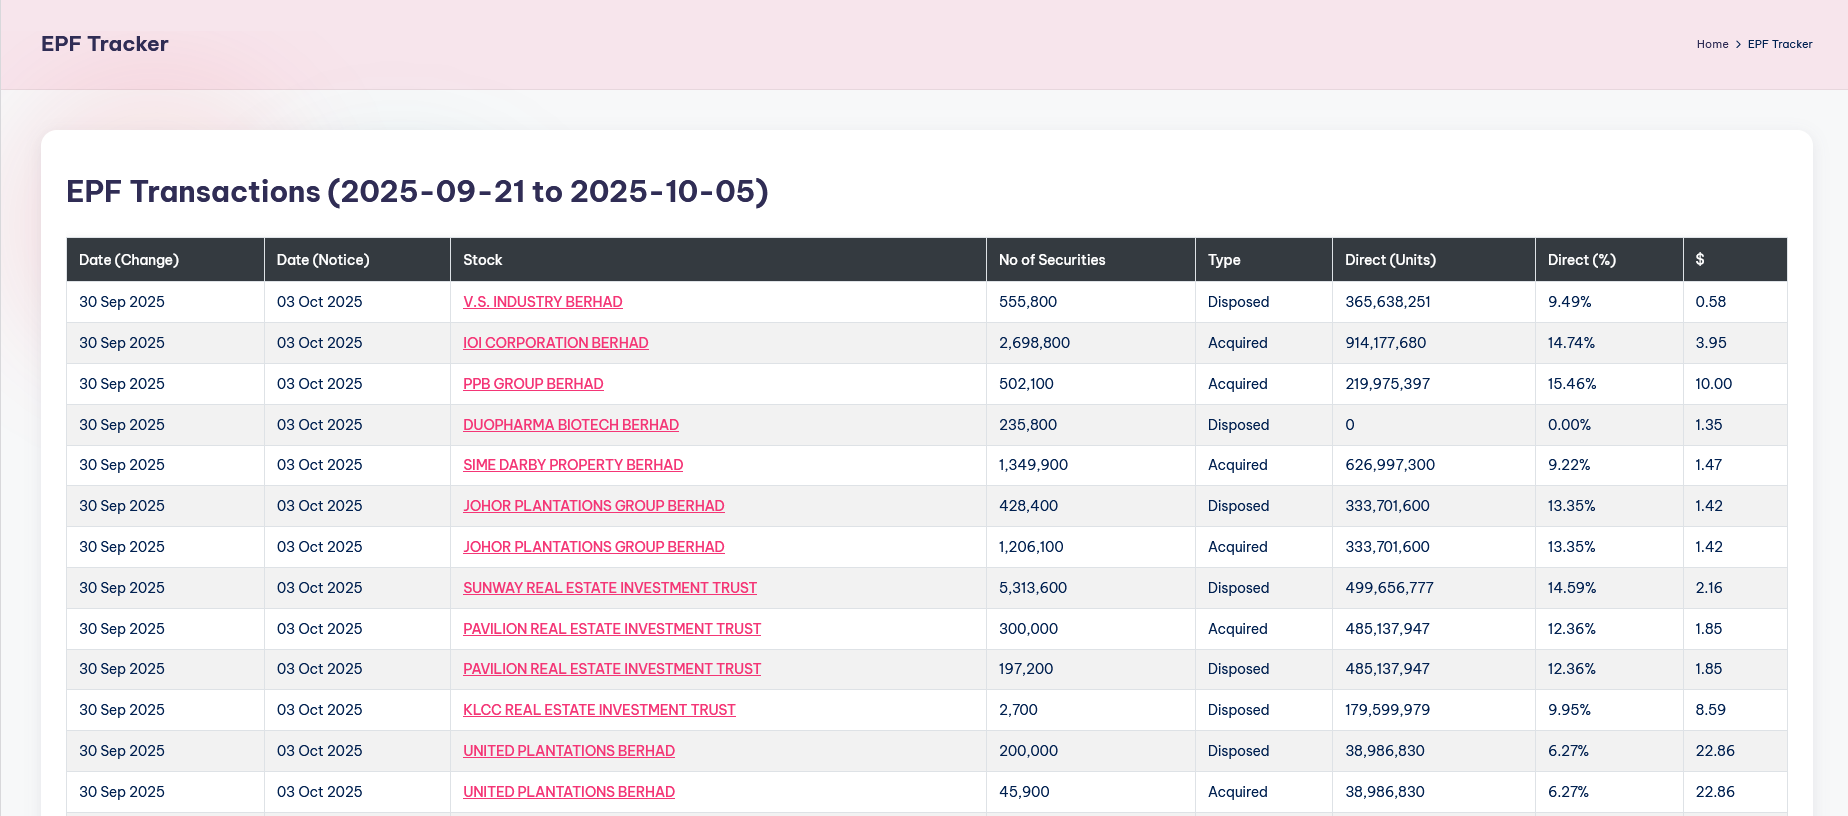
The EPF has a proven track record of achieving above-average returns. This page allows you to “follow the smart money.”
How to Use It:
Track the buying and selling activities of the EPF. Stocks that are being accumulated by the EPF can be a excellent source of ideas for your own watchlist and further research.
Important Disclaimer
Disclaimer: The data, strategies, and alerts on Stock-lah.com are compiled and presented for informational and educational purposes only. They are generated algorithmically and do not constitute financial advice or a recommendation to buy or sell any security. Investment decisions should not be made based solely on this information. You must conduct thorough personal research and consult with a qualified financial advisor before making any investment decisions. Past performance of the strategies is not indicative of future results.