
Gamuda’s latest quarterly revenue report, review and outlook for investors.
Stock Snapshot (as of 22 August 2025):
Share Price & Range
- Latest Price: RM 5.70 — unchanged as of August 22, 2025 closing.
- Intraday Range (Aug 22): RM 5.69 – RM 5.80
- 52-Week Range: RM 3.48 – RM 5.80
Trading Volume
- Volume on Aug 22: ~23.39 million shares
- 3-Month Average Volume: ~19.99 million shares
Valuation Metrics
- Forward P/E: ~31.05×
- Trailing P/E (TTM): ~35.20×
- Price-to-Book (P/B): ~2.75×
- Price-to-Sales (P/S): ~2.08×
- Price-to-Cash-Flow: ~28.23×
Dividend & Yield
- Dividend Yield: ~1.75%
Market & Financials
- Market Capitalization: RM ~33.04 billion (~USD 7.81 billion)
- Debt-to-Equity (Total): ~78.54%
Performance Trends
- Trading near its 52-week high, indicating strong recent momentum.
- 1-year price return: approximately +49.6% gain.
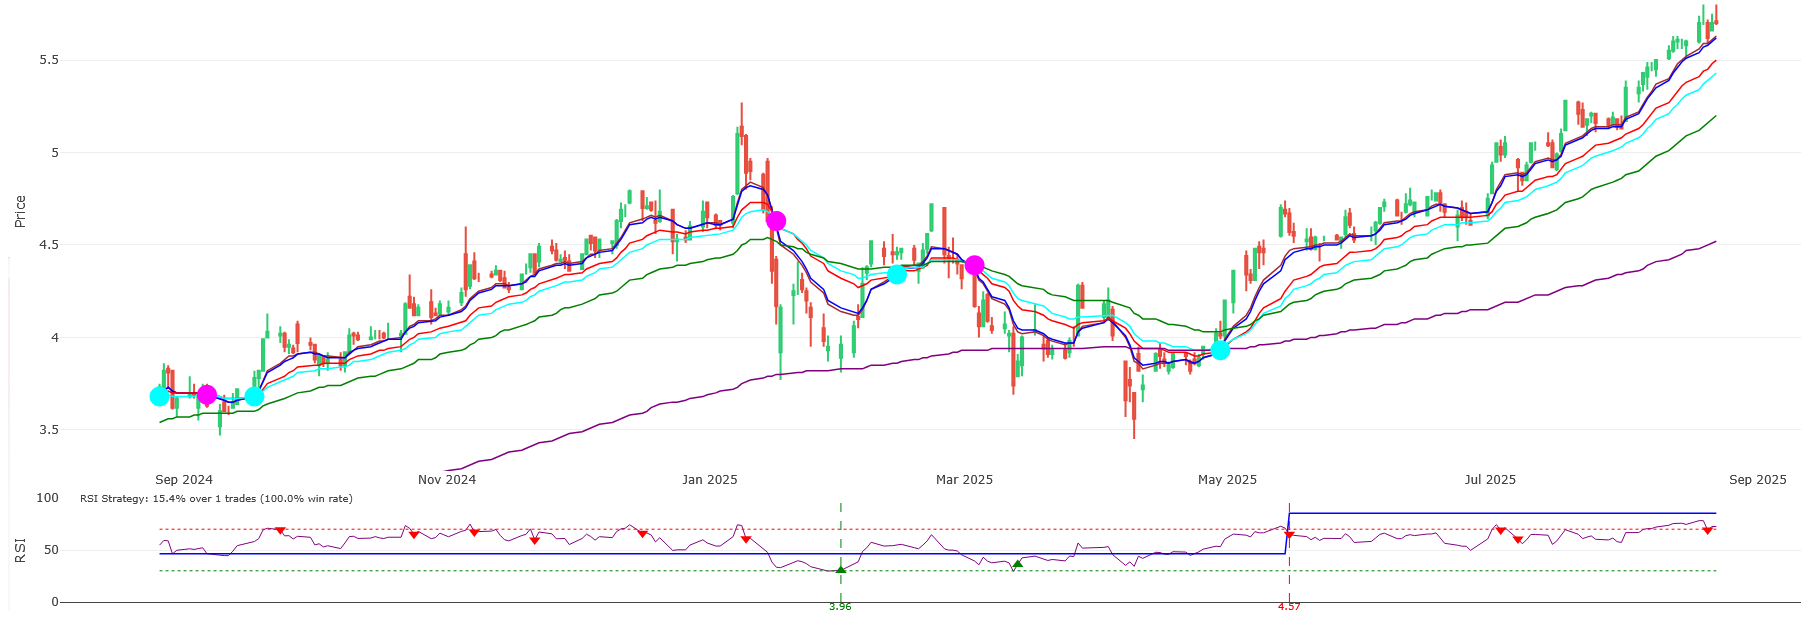
Technical Indicators
- Buy signal: Technicals show a “Strong Buy” rating, especially on the 1-month horizon
- RSI: Indicates an overbought condition — caution ahead of potential pullback.
Summary at a Glance
| Metric | Value / Insight |
|---|---|
| Share Price | RM 5.70 (close on Aug 22, 2025) |
| Intraday Range | RM 5.69 – RM 5.80 |
| 52-Week Range | RM 3.48 – RM 5.80 |
| Volume (Aug 22) | ~23.4M shares |
| Avg. Volume (3-month) | ~20M shares |
| Forward P/E | ~31× |
| Trailing P/E (TTM) | ~35× |
| P/B | ~2.75× |
| P/S | ~2.08× |
| Price-to-Cash Flow | ~28× |
| Dividend Yield | ~1.75% |
| Market Cap | RM 33B / US$7.8B |
| Debt-to-Equity (Total) | ~79% |
| 1-Year Price Return | +49.6% |
| Technical Outlook | Strong Buy signal, but RSI is high (overbought) |
Peer Comparison Overview
Key Competitors in the Malaysian Construction & Infrastructure Sector:
- IJM Corporation Berhad — Diversified in construction, property, infrastructure, concessions .
- UEM Group, YTL Corporation Berhad, MRCB, Sunway Construction (SunCon) — active in related segments
Valuation Comparison:
- Gamuda‘s forward P/E sits around 34.9×, above the peer average of 24.3×
- SunCon: ~29.1×
- IJM: ~25.2×
- Kerjaya: ~15.3×
- Kelington Group: ~27.6×
- Industry average P/E is approximately 15.2×, making Gamuda relatively expensive even within its sector.
Peer Comparison Snapshot
Valuation & Growth — Gamuda vs SunCon vs IJM (Aug 2025)
| Company | Forward P/E | Projected EPS CAGR | Dividend Yield (TTM) | Notes |
|---|---|---|---|---|
| Gamuda | ~11× (CY25F) | ~14% (3-year CAGR FY22–25F) | ~1.75% | Lower valuation than past, solid orderbook (~RM24 billion) |
| SunCon | ~16.5× (CY25F) | ~15% (3-year EPS CAGR FY23–26F) | ~2.5–3.0% (expected) | Vertically integrated; strong ROE; data center edge |
| IJM | ~17.6× (forward) | ~49.8% (5-year avg earnings growth) | (Not specified) | Diversified business; fair value estimated slightly above current price |
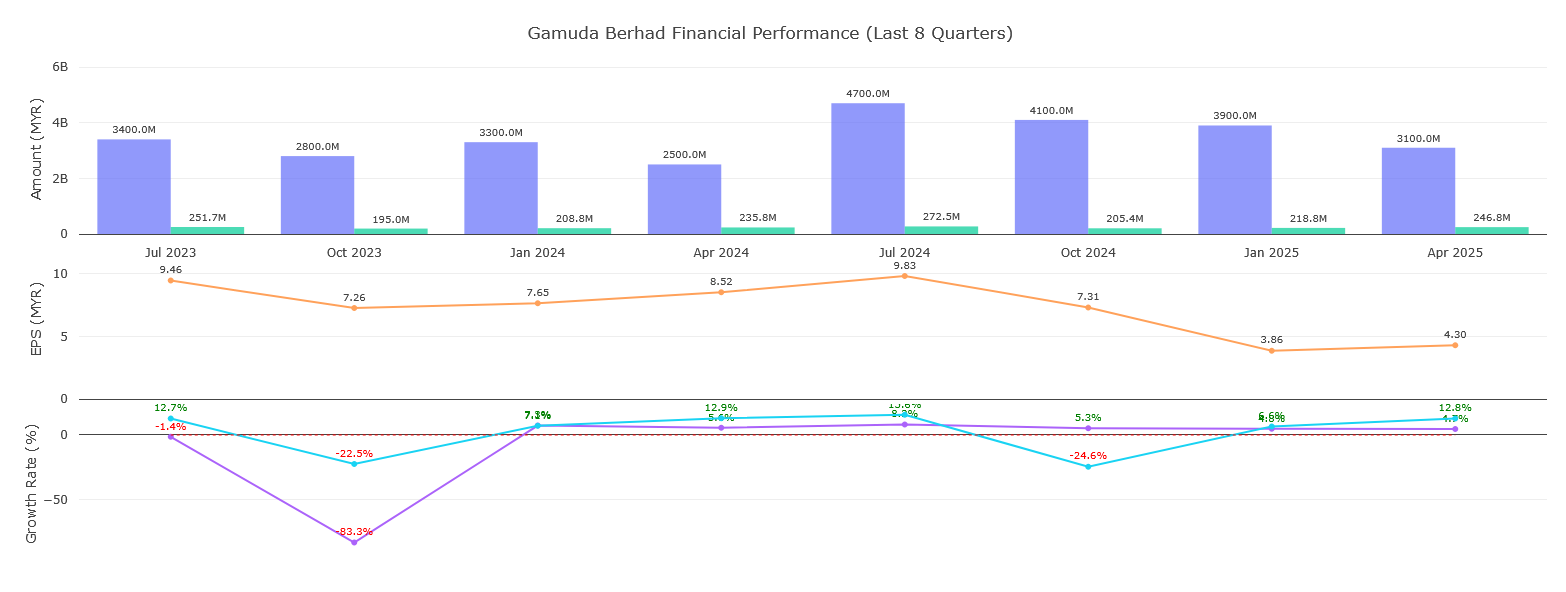
Earnings Growth (EPS CAGR):
- Gamuda: 3-year CAGR ~5%, 5-year CAGR ~8%
- By comparison:
- Kerjaya: 5-year CAGR ~7%
- IJM: 5-year CAGR ~11%
- SunCon: 3-year CAGR ~22%, 5-year ~15%
- Kelington: High growth — 3-year CAGR ~53%, 5-year ~35%
Bottom Line: Gamuda trades at a premium relative to peers yet delivers average earnings growth. Peers like SunCon and Kelington are delivering stronger EPS growth trajectories, while Gamuda’s premium valuation suggests the market is pricing in its infrastructure prowess and backlog visibility.
Metric Gamuda (Aug 2025) Peers & Insights Forward P/E ~34.9× — high relative to peers (~24.3×) Indicates premium valuation EPS Growth (CAGR) 3Y: ~5% / 5Y: ~8% Lower than SunCon, IJM, Kelington Dividend Yield ~1.75% (RM 0.10 annually) Below sector avg (~2.2%) Payout Ratio ~20% (earnings coverage solid) Conservative dividend approach
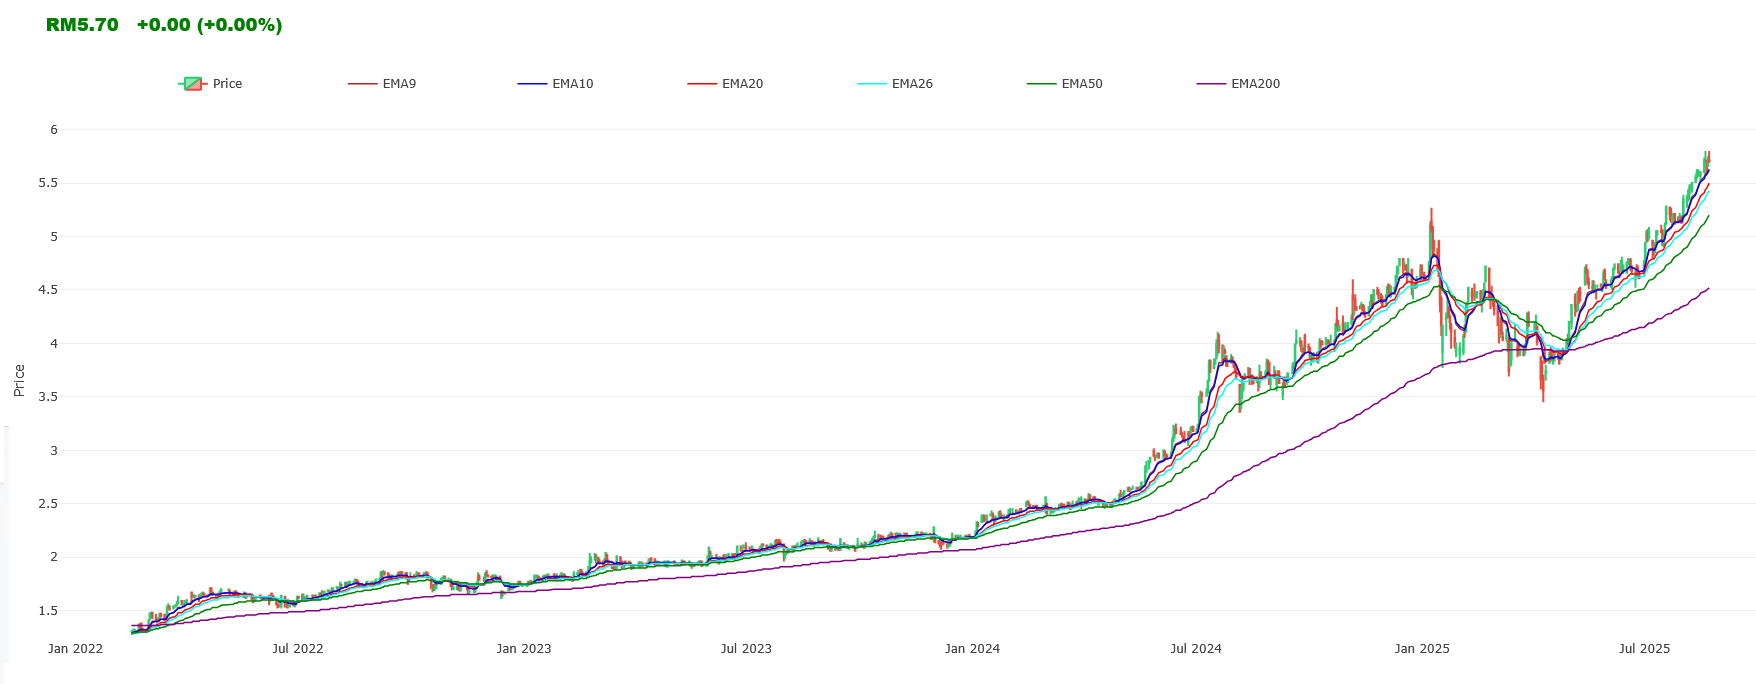
The analysis reveals a powerful and well-structured bull market. After a significant decline in 2022, the stock embarked on a sustained recovery, breaking into a clear uptrend. The forecast projects this uptrend to continue, culminating in a new All-Time High (ATH) by the end of 2025. The current price (August 2025) is positioned in a healthy pullback within this larger upward trajectory, presenting a potential opportunity before the projected final leg up.
1. Trend Analysis
- 2023 – 2025 (Bull Phase): A decisive and powerful uptrend began. The chart shows a classic pattern of Higher Highs (HH) and Higher Lows (HL), confirming a strong bullish structure.
- Mid-2025 (Current Action): The price action from May to August 2025 is not a breakdown but a healthy pullback or consolidation within the larger uptrend. It is a pause to digest gains before the forecasted next move.
- Projection (End of 2025): The forecast models a continuation of this bull trend, projecting a new All-Time High of MYR 5.99 by December 17, 2025.
Conclusion: The primary trend is unequivocally UP. The projected path is a continuation of this established bullish sequence.
2. Support & Resistance (Key Levels)
- Projected All-Time High (Target): MYR 5.99 (Dec 17, 2025). This is the forecasted terminus of the current bull cycle.
- Immediate Resistance (to break): ~MYR 5.75 – MYR 5.80. The price must overcome this level to begin the projected ascent towards the new high.
- Immediate Support (Critical): ~MYR 5.20. This is the low of the current pullback (May-Aug 2025). This level must hold to keep the “higher low” structure intact and validate the bullish forecast.
- Major Support (Bull Market Defense): ~MYR 4.80. This former resistance-turned-support level is the last major defense for the bulls. A break below this would invalidate the entire bullish forecast and signal a much deeper correction.
3. Volume Analysis
- Bull Run Confirmation: The rise from the 2022 lows was accompanied by periods of high volume, confirming institutional accumulation during key breakout phases (e.g., above MYR 4.50).
- Current Pullback: Volume has subsided during the recent pullback to the MYR 5.20 area. This is a positive sign; it indicates a lack of aggressive selling pressure and is typical of a healthy consolidation.
- What to Watch (Projected): For the forecasted rally to MYR 5.99 to be validated, the breakout above MYR 5.80 should ideally occur on a significant increase in volume.
4. Moving Averages (MAs)
- Golden Cross: A bullish Golden Cross (50-day MA crossing above the 200-day MA) occurred in 2023, cementing the long-term trend change.
- Current Alignment: The price (MYR 5.69) is currently trading above the rising 200-day MA but has pulled back to test its 50-day MA. This is a classic and healthy setup within a strong uptrend. The 50-day MA is providing dynamic support.
- The rising 200-day MA (around ~MYR 4.90) serves as a strong foundation for the entire bull market.
5. Momentum Indicators (MACD)
- Current Signal: The MACD has dipped towards the zero line but remains in positive territory. This indicates that while short-term momentum has waned during the pullback, the underlying bullish momentum has not yet been broken.
- Projected Signal: For the forecasted new high to be achieved, we would expect to see the MACD cross back up and begin to advance, confirming a renewal of positive momentum.
6. Chart Patterns
- Completed Pattern: Large Base/Cup and Handle. The rise from 2022 into 2024 formed a massive multi-year base, which was the fuel for the initial powerful breakout.
- Current Pattern (Mid-2025): Bull Flag/Pennant. The price action from the high near MYR 5.80 down to MYR 5.20 and the current bounce resembles a Bull Flag consolidation pattern. These are typically continuation patterns, implying the previous upward move is likely to resume. The forecast to MYR 5.99 aligns perfectly with this pattern interpretation.
7. Candlestick Analysis (Recent Action)
- The bounce off the MYR 5.20 support level is a positive sign. The candles show buying interest returning at a key level.
- There are no major bearish reversal patterns at the recent highs, suggesting the pullback is corrective and not the start of a new downtrend.
Interpretation
The chart forecasts a completed pullback and the resumption of the bull market towards a new high.
Bullish Scenario (The Projected Path):
The stock holds above the MYR 5.20 support and the 50-day MA. It gathers momentum, breaks through the MYR 5.80 resistance on increasing volume, and begins its next leg up towards the projected target of MYR 5.99+.
Risk Scenario (Invalidation of the Forecast):
The stock fails to hold the MYR 5.20 support. This would break the pattern of Higher Lows and signal that the pullback is deeper than forecasted. A break below the next major support at MYR 4.80 would completely invalidate the bullish forecast and suggest the model is incorrect.
Actionable Takeaway
- For Holders: The forecast is bullish. The strategy should be to hold as long as the price remains above the MYR 5.20 support level. A break below this could signal a deeper correction than projected.
- For New Buyers: The current pullback to the MYR 5.60 – MYR 5.70 area (near the 50-day MA) could be seen as a potential entry point within the forecasted uptrend, but only if the MYR 5.20 support holds.
- A more conservative entry would be to wait for a confirmed breakout above the MYR 5.80 resistance level.
- Crucial Note: All decisions must be made with a strict stop-loss strategy. The logical level for a stop-loss would be below the MYR 5.20 support level, as a break there invalidates the immediate bullish structure.
Disclaimer: This analysis is based on a dataset that includes projected future prices. Forecasting is inherently uncertain and carries significant risk. This is not financial advice. The market is volatile, and actual results may differ drastically from any forecast. Always conduct your own research and consult with a qualified financial advisor before making any investment decisions.