Investment Report: Frontken Corporation Berhad (FRONTKN) – Q2 2025 Review and Outlook for Investors
1. Q2 2025 Financial Performance
Frontken Corporation Berhad announced its unaudited financial results for the second quarter ended June 30, 2025 (2QFY2025) on August 5, 2025.
Key Metrics
| Metric | 2Q25 (RM mil) | 2Q24 (RM mil) | Change | Notes |
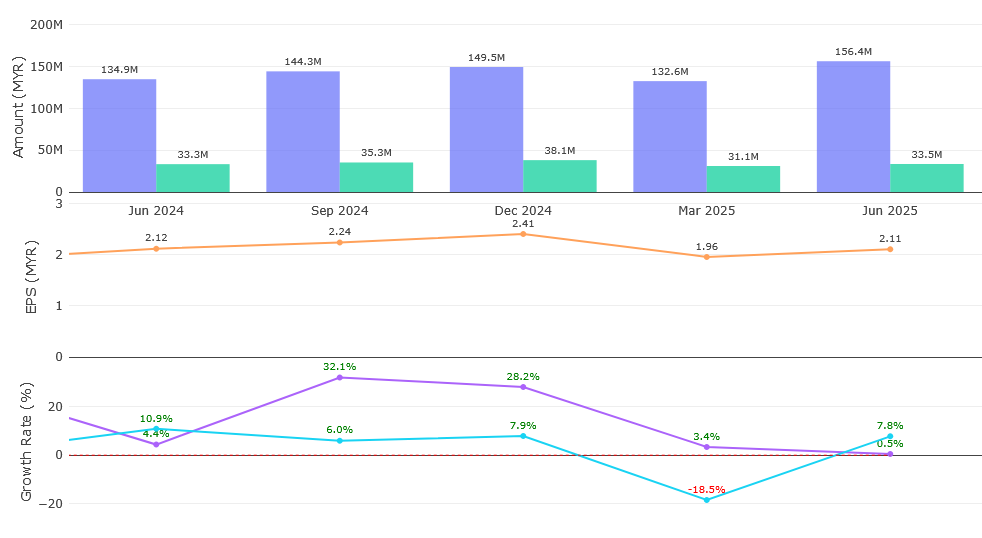
| Revenue | 156.432 | 134.925 | +16% | Increased from the corresponding quarter of the previous year. This growth reflects strong market performance and higher contributions from subsidiaries in Taiwan and Malaysia. |
| Profit Before Tax | 47.623 | 46.404 | +2.6% | Slightly up from the same quarter last year, highlighting the company’s resilience. |
| Net Income | 33.489 | 33.334 | Flat | Profit for the period attributable to ordinary equity holders was largely flat compared to the previous year. If foreign exchange loss were excluded, net profit would have increased by 55% to RM55.91 million. |
| Profit Margin | 21% | 25% | -4% | The decrease in margin was driven by higher expenses. |
| EPS (Basic) | RM0.021 | RM0.021 | In line | Basic earnings per share was RM0.021 for both 2Q25 and 2Q24. |
| Proposed Dividend per share | 2.00 sen | 1.70 sen | +17.6% | A higher dividend was declared, indicating the company’s commitment to returning value to shareholders. |
Highlights
• Foreign Exchange Loss Impact: The reported flat net profit was significantly affected by a foreign exchange loss totaling RM19 million. This loss primarily stemmed from the revaluation of foreign currency bank balances, which were initially earmarked for a proposed acquisition in the U.S. that ultimately did not materialize due to a last-minute change by the vendor. Without this “paper loss,” the profit after tax would have been RM55.91 million, marking their strongest quarterly result to date.
• Revenue Growth Drivers: The 16% year-on-year revenue increase was largely driven by higher contributions from Frontken’s subsidiaries in Taiwan and Malaysia. The semiconductor business experienced increased volume due to strong demand and a favorable product mix from customers in Taiwan.
• Oil and Gas (O&G) Sector Recovery: The O&G business showed a pick-up in activity after the Lunar New Year and Hari Raya Holidays. This suggests a potential recovery in this segment, which had seen lower contributions in Q1 2025 due to fewer operational days and the absence of one-off projects.
• Operational Efficiency: While the profit margin saw a slight decrease in Q2 2025, the company’s management remains optimistic about its outlook, emphasizing continued efforts in improving operational efficiency.
• Year-to-Date Performance: For the first half of the financial year (H1 2025), Frontken’s net profit inched up 1.84% to RM64.56 million, with revenue expanding 4.92% year-on-year to RM288.99 million.
3. Growth Drivers & Risks
Opportunities
• Semiconductor Demand & AI Boom: Frontken is well-positioned to benefit from the robust demand in the semiconductor space, particularly driven by the Artificial Intelligence (AI) boom. The company’s exposure to leading foundries like TSMC, which is a major client, allows it to capitalize on the increasing demand for advanced chips. TSMC’s strong performance, including a near 61% year-on-year rise in Q2 profit due to strong AI chip demand, directly benefits Frontken.
• Capacity Expansion: Frontken is actively exploring ways to better support its customers, including increasing its capacities. This includes potential expansion with a new Tainan Plant 3 (following land acquisition) and continued collaboration efforts.
• O&G Sector Recovery: After experiencing some softness in Q1, the Oil and Gas segment has shown signs of picking up, with an expected rebound in later quarters due to various contracts.
Risks
• Geopolitical Tensions and Tariffs: The group acknowledges that geopolitical tensions, ongoing trade disputes, and new tariff rates continue to pose macroeconomic uncertainties. Discussions among analysts and market participants highlight concerns about U.S. chip tariffs and the potential impact on Malaysia’s semiconductor sector, although some believe exemptions or strategic repositioning could mitigate effects.
• Customer Concentration: The company’s significant reliance on a leading foundry in Taiwan (TSMC) for a majority of its semiconductor revenue presents a customer concentration risk. While currently an opportunity due to TSMC’s strong performance, any adverse impact on this key customer could affect Frontken.
• Industry Recovery Pace: A prolonged or slower-than-anticipated recovery in the broader semiconductor industry could impact Frontken’s growth trajectory.
• Currency Fluctuations: The recent RM19 million foreign exchange loss demonstrates the vulnerability to currency revaluation, especially concerning international transactions and potential acquisitions.
4. Analyst Ratings & Price Targets
Analyst sentiment towards Frontken Corporation Berhad is generally positive:
• Consensus Rating: Based on opinions from 10 analysts in the past 3 months, the overall rating for FRONTKN stock was calculated as “strong buy”.
• Average 1-Year Price Target: According to Wall Street analysts, the average 1-year price target for FRONTKN is 4.72 MYR.
◦ Max Estimate: Analysts offer a maximum estimate of 6.00 MYR, with some specific forecasts going up to 5.36 MYR and even 6.00 MYR (CLSA).
◦ Min Estimate: The minimum estimate is 4.00 MYR, with some specific forecasts going down to 4.04 MYR and 4.80 MYR (Macquarie).
• Upside Potential: The average target price of 5.20 MYR (based on past 6 months data) implies an upside of +0.85 MYR (19.54%) from the last price of 4.35 MYR.
• Specific Brokerage Ratings (Recent):
◦ Phillip Capital: Maintained a “BUY” call with a price target of 5.20 MYR.
◦ JPMorgan: Raised PT to MYR4.90.
◦ CLSA: Raised PT to MYR6.00.
◦ Nomura/Instinet: Raised PT to MYR5.43.
◦ Macquarie: Lowered PT to MYR4.80.
| Brokerage | Rating | Price Target (MYR) |
|---|---|---|
| CLSA | Strong Buy | 6.00 (Highest) |
| Phillip Capital | Buy | 5.20 |
| Macquarie | Hold | 4.80 (Lowest) |
| Average Target | 4.72 | +19.5% Upside (from 4.35 MYR) |
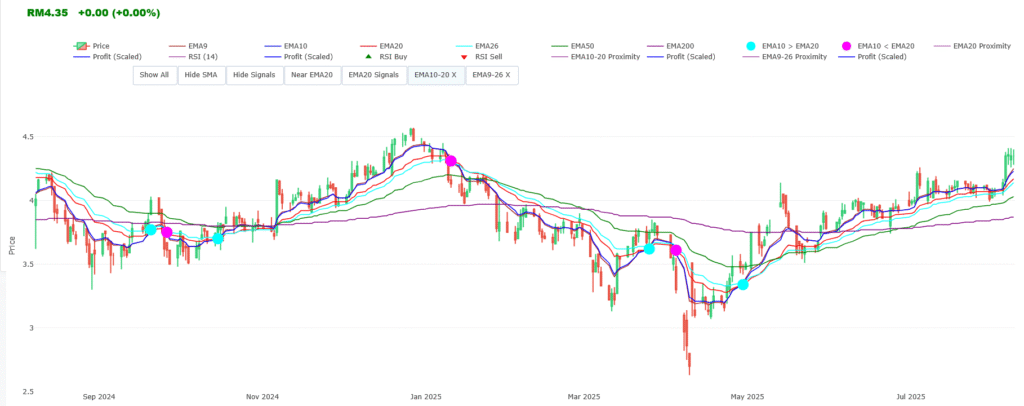
5. Technical Outlook (As of August 8, 2025)
FRONTKN’s last traded price was 4.35 MYR. The stock traded between a high of 4.40 MYR and a low of 4.28 MYR on August 8, 2025. Its 52-week range is 2.630 MYR to 4.566 MYR. The stock price was up 8.7% from a week ago as of August 6, 2025. Trading volume for the day was 6.70 million shares.
Historically, the stock has shown resilience, rebounding over 56% from its lows in April during the global tariff turmoil.
6. Investment Decision Summary
✅ Buy Arguments
• Resilient Profitability Despite Headwinds: Despite a significant foreign exchange loss, Frontken reported flat net income for 2Q25, which would have been its strongest quarterly result had the loss been excluded. This demonstrates the underlying strength of its core operations.
• Strong Revenue Growth: The company achieved a 16% year-on-year increase in revenue for 2Q25, primarily driven by robust demand in the semiconductor segment and strong contributions from its Taiwan and Malaysia subsidiaries.
• Exposure to High-Growth Segments: Frontken’s strong ties with leading foundries like TSMC position it favorably to benefit from the surging demand for advanced chips driven by AI.
• Increased Shareholder Returns: The declaration of a higher dividend of 2.00 sen per share signals management’s confidence and commitment to returning value to investors.
• Positive Analyst Consensus: The overwhelming “strong buy” consensus from analysts, coupled with attractive average and high price targets, suggests significant upside potential.
✔ AI-driven semiconductor demand (TSMC exposure).
✔ O&G recovery in H2 2025.
✔ Capacity expansion (e.g., Tainan Plant 3).
⚠ Cautionary Factors
• Macroeconomic Uncertainties: Ongoing geopolitical tensions, trade disputes, and new tariff rates create a volatile environment that could impact future performance.
• Customer Concentration: A heavy reliance on a single leading foundry in Taiwan could expose the company to risks if that customer’s performance or strategy changes.
• Foreign Exchange Volatility: The substantial foreign exchange loss in Q2 2025 highlights the impact of currency fluctuations on reported earnings, especially with international operations and potential future acquisitions.
✖ Geopolitical tensions (U.S.-China tariffs).
✖ Customer concentration (TSMC reliance).
✖ Forex volatility (RM19m loss in Q2).
Actionable Insight: Frontken’s Q2 2025 results, despite being impacted by a significant non-operational foreign exchange loss, demonstrate underlying operational strength driven by strong semiconductor demand. The company’s strategic positioning within the AI-driven chip industry and positive analyst outlook reinforce its growth potential. Investors should closely monitor geopolitical developments and foreign exchange rate movements. The company’s share buybacks in the past may or may not indicate undervaluation and require deeper analysis.
Disclaimer: This report is compiled solely based on the provided source excerpts for informational purposes and discussion. It does not constitute financial advice. Investment decisions should be made after conducting thorough personal research and consulting with a qualified financial advisor.