
So, you’ve decided to dip your toes into the world of stock investing. Welcome! It’s an exciting journey that can be both rewarding and educational. But if you’re staring at charts full of squiggly lines and mysterious acronyms like RSI and MACD, it can also feel incredibly overwhelming.
You’ve likely heard of “technical analysis” (TA) – the art (and science) of analyzing historical price and volume data to forecast future price movements. For a new investor, it can seem like a secret language used by Wall Street pros. But what if you could learn the basics of this language to make more informed decisions?
This guide is your friendly introduction. We’ll break down technical analysis into simple, actionable concepts and then apply them to a real Malaysian stock—Vitrox (0097)—using the data provided.
First, A Crucial Reality Check
Before we look at a single chart, let’s get one thing straight: Technical analysis is not a crystal ball. It doesn’t guarantee success. Think of it less as a fortune-telling tool and more as a weather forecast. A forecast tells you the probability of rain, so you can decide to carry an umbrella. Similarly, TA gives you probabilities about market direction, so you can make smarter decisions about when to buy or sell.
It’s also wise to remember that many successful investors combine technical analysis with fundamental analysis (looking at a company’s financial health, industry, etc.). For now, we’ll focus on the technical side to get you started.
The Core Belief of Technical Analysis
All of technical analysis rests on three fundamental ideas:
- The Market Discounts Everything: This means a stock’s current price reflects all known information—news, investor sentiment, economic data, you name it.
- Price Moves in Trends: Prices are more likely to continue a past trend than to move erratically. The famous saying is, “The trend is your friend.”
- History Tends to Repeat Itself: Market psychology is predictable. Patterns of crowd behavior that have happened in the past will likely happen again in the future.
Your Starter Kit: 4 Simple Technical Analysis Concepts
You don’t need to learn everything at once. Start with these four foundational concepts.
1. Support and Resistance: The Market’s Floor and Ceiling
This is the most fundamental concept in TA.
| Support: A price level where a falling stock often finds a “floor” and bounces back up. It’s where demand (buying) tends to step in. Think of it as the price the market seems to think is a “good deal.” |
| Resistance: The opposite. A price level where a rising stock finds a “ceiling” and struggles to break through. It’s where supply (selling) tends to step in. Think of it as the price the market sees as “getting expensive.” |
How to use it: New investors can use these levels to plan entries and exits. Buying near support and selling near resistance is a classic strategy.
2. The Trend: Your Best Friend
Identifying the overall direction of a stock’s price is job #1.
| Uptrend: A series of higher highs and higher lows. The overall direction is up. |
| Downtrend: A series of lower highs and lower lows. The overall direction is down. |
| Sideways/Ranging Trend: The price is bouncing between a clear support and resistance level without a clear upward or downward direction. |
How to use it: It’s generally easier to make money when you trade with the trend. In an uptrend, focus on buying opportunities. In a downtrend, it’s often better to wait on the sidelines or look for selling opportunities.
3. Volume: The Fuel Behind the Move
Volume is the number of shares traded in a period. It’s the proof behind the price move.
| High Volume: Gives credibility to a price move. A price breakout above resistance on high volume is a stronger signal than one on low volume. |
| Low Volume: Suggests a lack of conviction. A price move on low volume might not be sustainable. |
How to use it: Always check the volume bars at the bottom of your chart. Is the big price move you’re seeing supported by high volume? If not, be skeptical.
4. Simple Moving Averages (SMA): The Smooth Operators
A moving average smooths out past price data to create a single flowing line. This makes it much easier to identify the underlying trend. The most common are the 50-day (medium-term trend) and 200-day (long-term trend) SMAs.
How to use it:
- Trend Direction: If the price is above its 200-day SMA, it’s generally in a long-term uptrend.
- Crossovers: When a faster-moving average (like the 50-day) crosses above a slower one (like the 200-day), it’s a bullish “golden cross.” When it crosses below, it’s a bearish “death cross.” These are popular signals for trend changes.
Case Study: Applying TA to Vitrox (Jan 2023 – Sep 2025)
Let’s take the chart and see how we could have used these concepts.
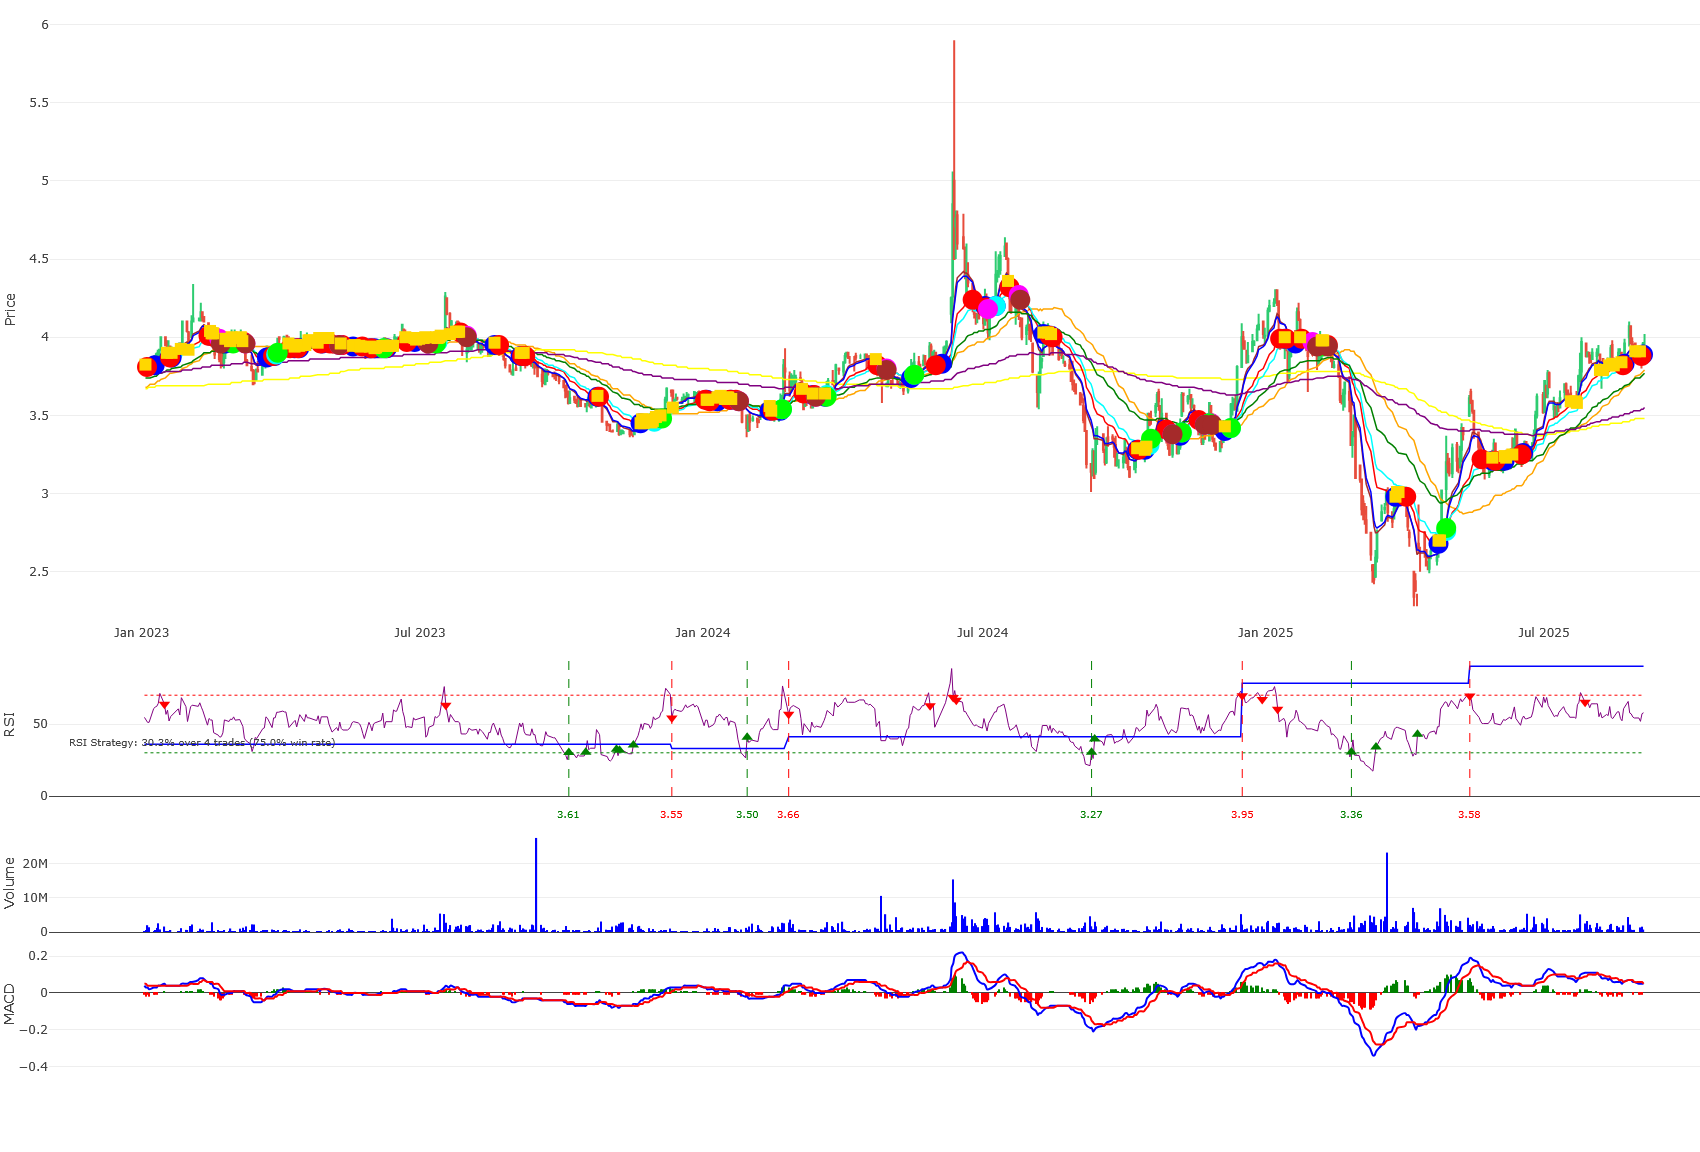
Understanding the chart:
- Volume: The number of shares traded.
- MACD (Moving Average Convergence Divergence): A trend-following momentum indicator. When the MACD line (the first value) crosses above the signal line (the second value), it’s a potential buy signal. When it crosses below, it’s a potential sell signal.
- RSI (Relative Strength Index): Measures the speed and change of price movements on a scale of 0 to 100.
- RSI > 70: The stock may be overbought (overly expensive) and could be due for a pullback. Consider selling or avoiding new buys.
- RSI < 30: The stock may be oversold (overly cheap) and could be due for a bounce. Consider buying or watching closely.
- RSI between 30-70 is generally considered neutral.
Walking Through the Vitrox Chart:
The 2023 Rally & Peak (Jan – Jul 2023):
- The price starts at RM 3.83 and begins a steady uptrend.
- In mid-July 2023, the price spikes to RM 4.26 on massive volume (5.26 million shares). This is a classic climax.
- The RSI hits 76, deep in overbought territory. This was a giant red flag warning that the rally was exhausted.
- What could a new investor do? This would not be a good time to buy. It would be a prime time to consider taking profits if you owned it.
The Long Downtrend (Aug 2023 – November 2023):
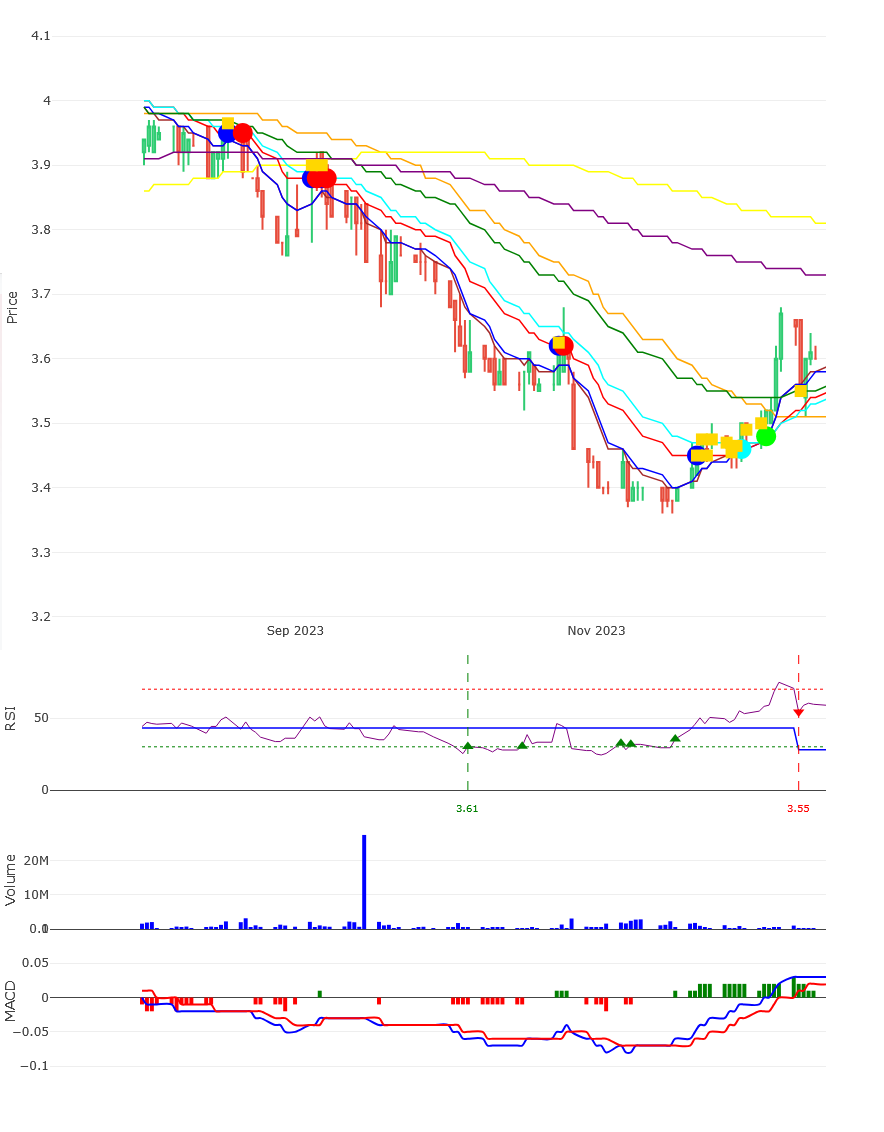
- The stock enters a brutal downtrend, falling from RM 4.26 to a low of RM 3.46 in October 2023.
- Notice how every time the price tried to rally, it was sold off (creating lower highs).
- The RSI frequently dipped below 30, showing it was oversold, but the trend was still down. Catching a falling knife is dangerous.
- What could a new investor do? The trend is down. The best action is often no action—stay away and wait for the trend to prove it has reversed.
The Reversal and New Bull Run (Jun 2024):
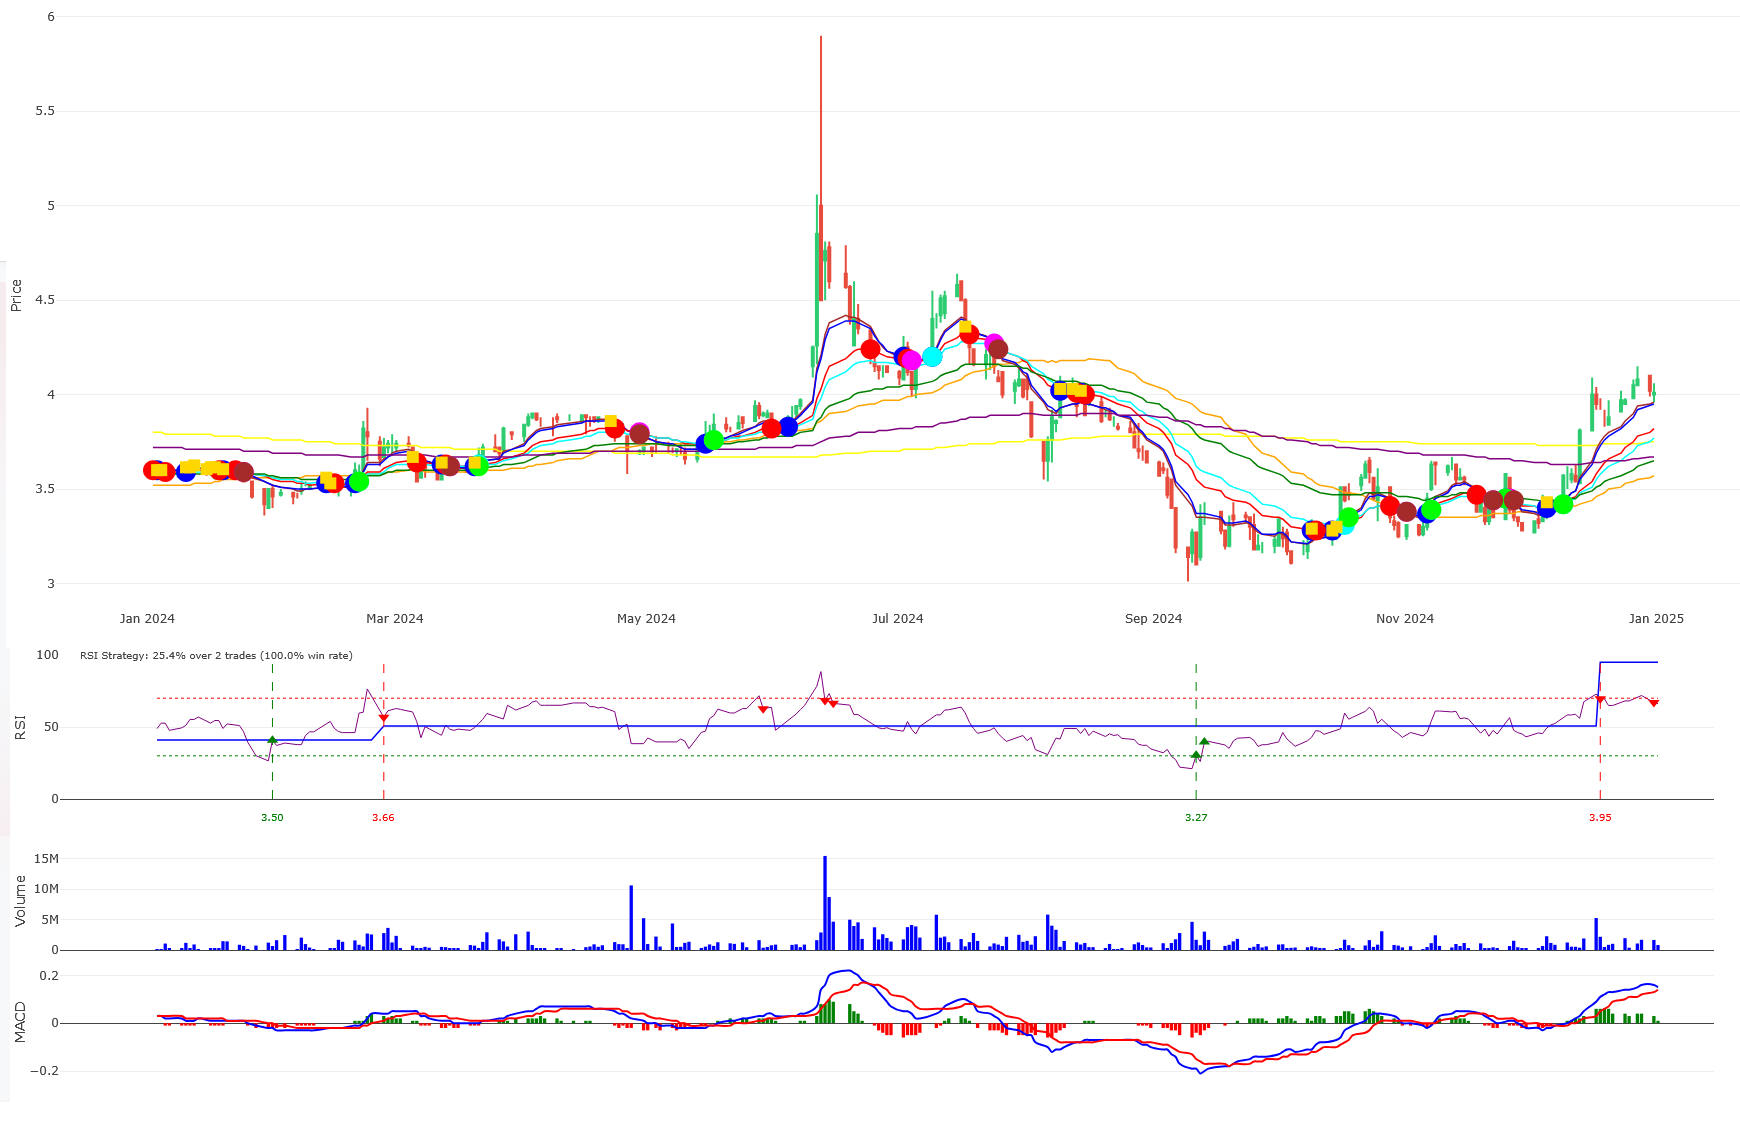
- In June 2024, something dramatic happens. The price jumps from ~RM 4.00 to RM 4.85 on enormous volume (28.7 million shares!).
- The MACD, which had been negative, surges into positive territory—a very strong buy signal.
- The RSI shoots up to 88, extremely overbought. However, a strong breakout often starts from overbought conditions.
- What could a new investor do? This is a potential trend reversal. A very aggressive investor might buy on the breakout, but a more conservative one would wait for a pullback.
The Volatile Period (Jun 2024 – Dec 2024):
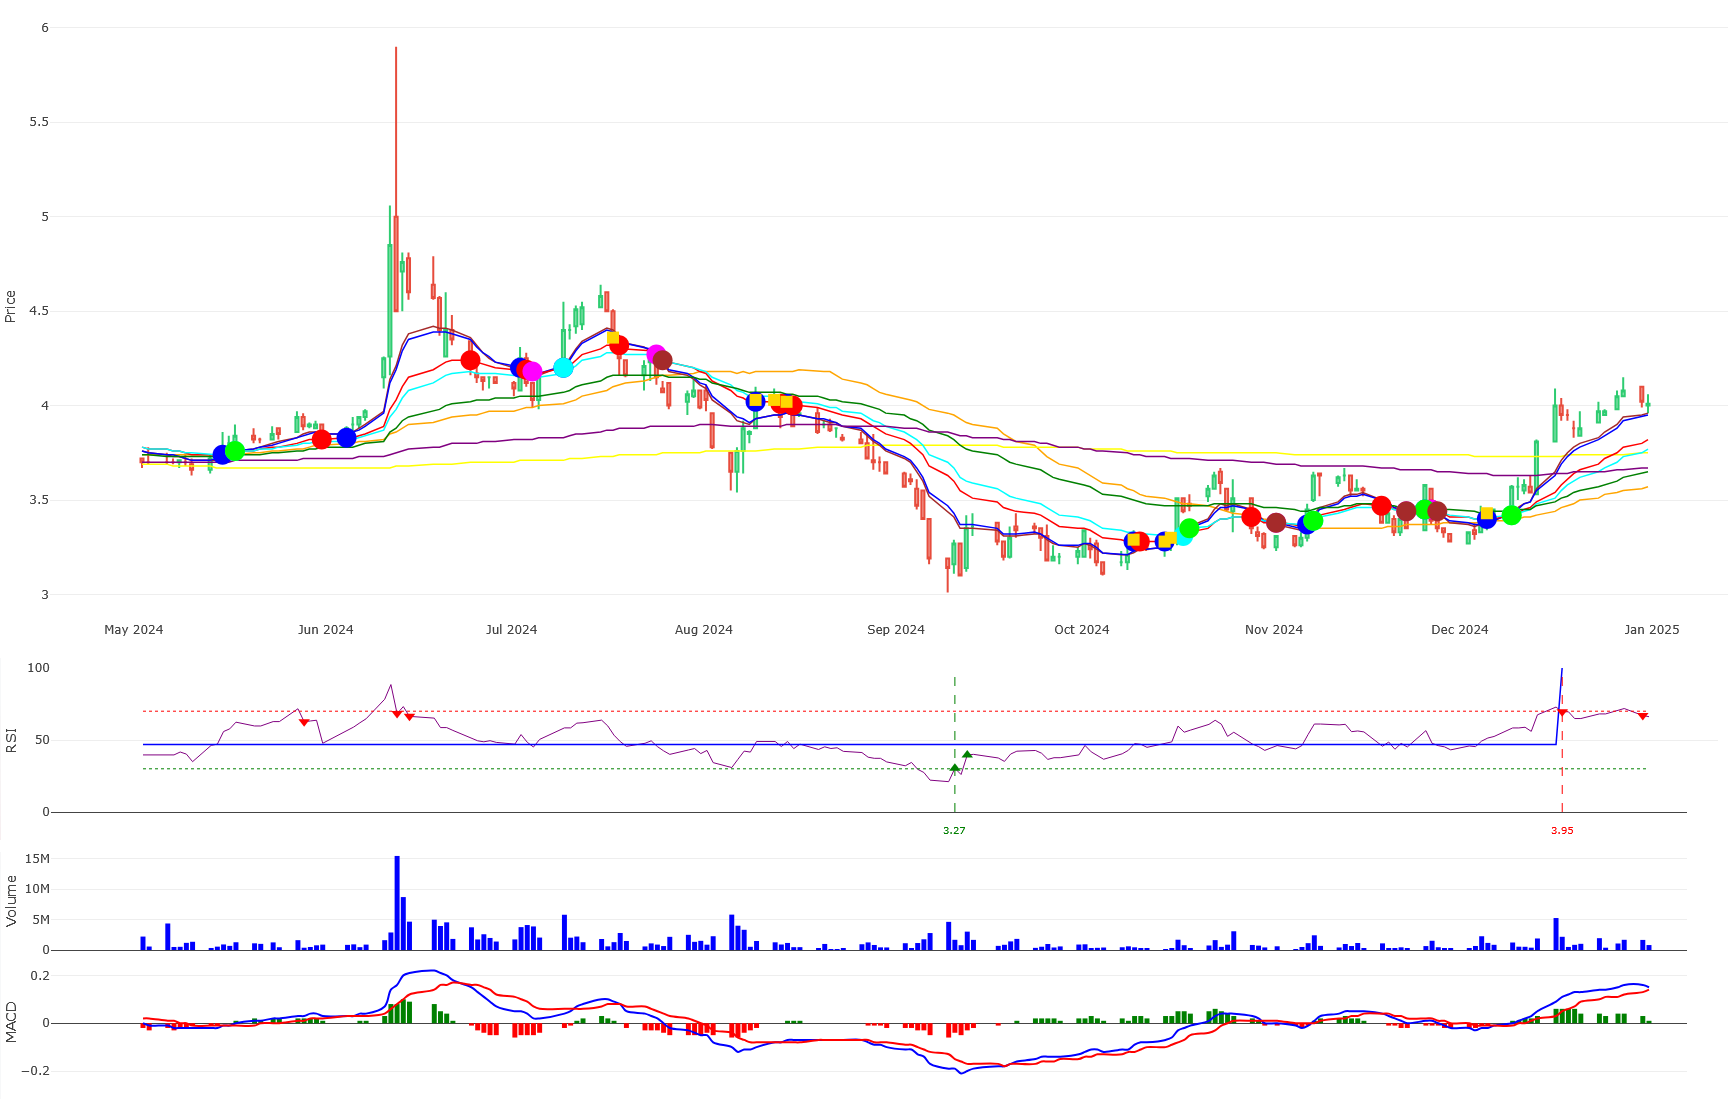
This period is not a simple consolidation and breakout; it’s a period of extreme volatility with a classic “spike and crash” pattern, followed by a more traditional consolidation.
- The Speculative Mania and Spike (Jun – Jul 2024):
- The price explodes from ~RM 4.00 in June to an astronomical high of RM 4.85 on June 11, 2024. This is not a normal breakout; it’s a parabolic spike.
- The volume is monstrous (15.43 million shares on June 12), indicating a frenzy of buying, likely driven by speculative retail investors.
- The RSI hits a maximum of 88.5, screaming that the stock is massively overbought. This is the biggest warning sign possible.
- What could a new investor do? This is an extremely dangerous time to buy. This is a textbook signal to take profits if you owned it from lower levels. Entering here would be chasing the price and is very high-risk.
- The Inevitable Crash (Jul – Aug 2024):
- After a peak, what goes up must come down. The stock predictably crashes from its highs of RM 4.85 back down to the RM 3.65 – RM 3.80 range by August 2024.
- The RSI falls from 88 to the 30-40 range, showing the overbought condition has been completely worked off.
- What could a new investor do? This confirms why buying during a parabolic spike is so risky. The correct action here is to stay away and wait for the dust to settle and a new trend to establish itself. The previous uptrend is broken.
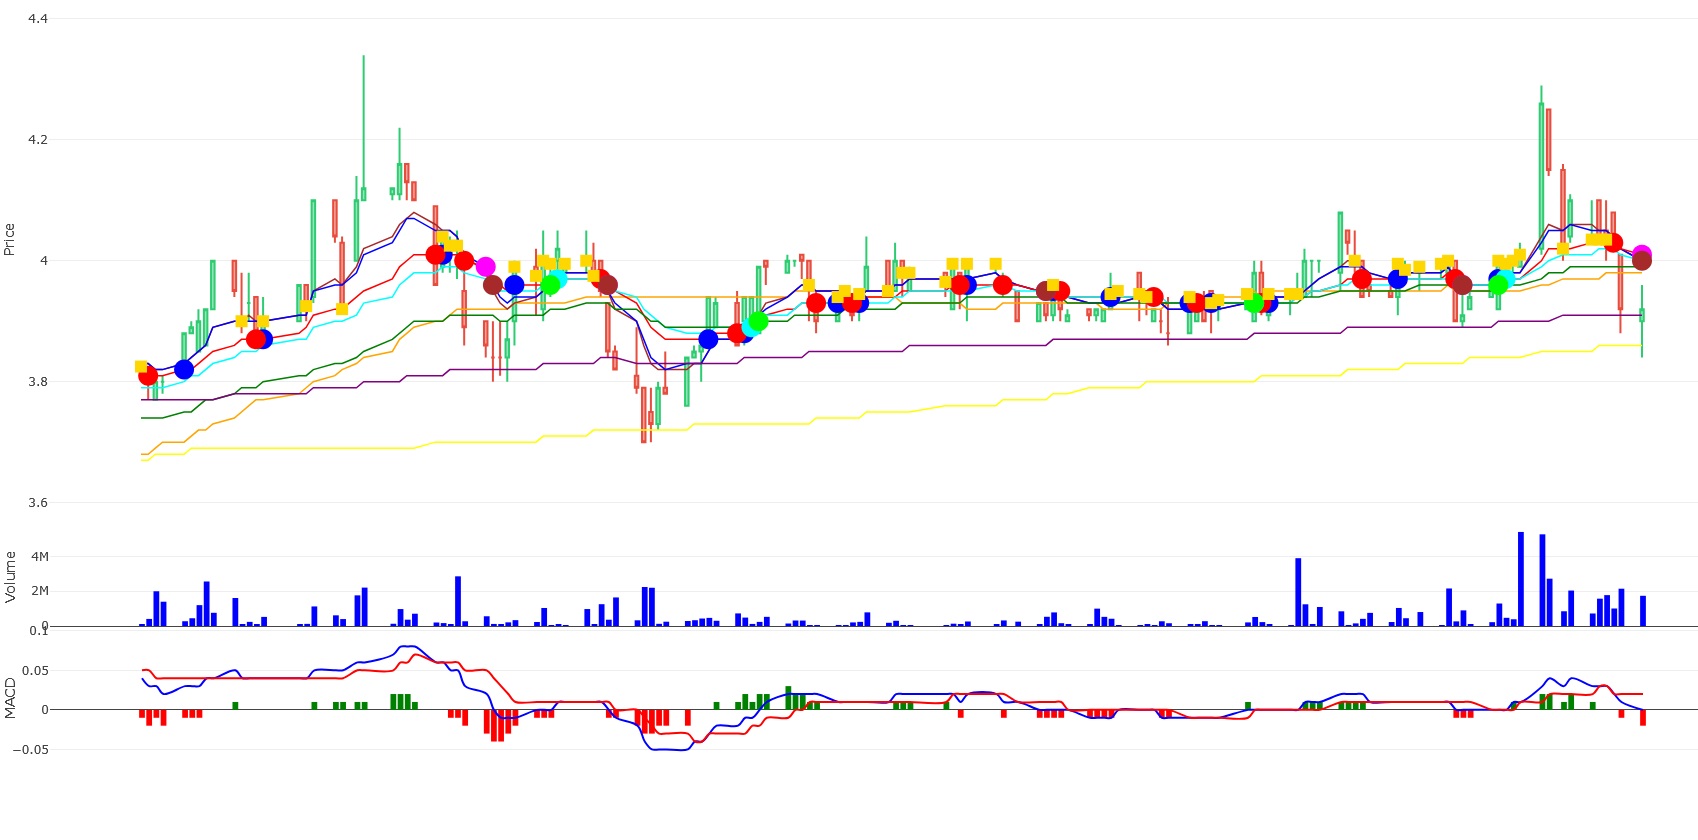
- The Genuine Consolidation (Sep – Dec 2024):
- After the crash, the stock enters a bona fide consolidation phase. It stops making new lows and begins trading in a range, roughly between RM 3.60 and RM 3.90 for several months.
- This is the market “digesting” the previous massive move and finding a fair value price where buyers and sellers are in balance.
- The volume during this period is generally lower than during the spike and crash, which is typical for a consolidation.
- What could a new investor do? This is a much safer environment to start looking for an entry than the June mania. An investor could plan to buy near the bottom of the range (support near RM 3.65) or wait for a breakout above the top of the range (resistance near RM 3.90) with high volume for confirmation.
- The True Breakout (Dec 2024):
- In mid-December 2024, the price finally breaks out above the RM 3.90 resistance level of its multi-month consolidation range.
- This move is accompanied by significantly higher volume (e.g., 5.25 million shares on Dec 16 vs. average volumes in the hundreds of thousands), giving the breakout credibility.
- The MACD moves firmly into positive territory and the RSI climbs into the 60-70 range (strong but not yet extremely overbought).
- What could a new investor do? This is the valid “breakout” signal. It’s a higher-probability entry point than buying during the June spike because it shows the stock has established a new base and is beginning a fresh leg up. A conservative stop-loss could be placed just below the breakout level (e.g., RM 3.85).
The Peak and Recent Decline (Jan – Sep 2025):
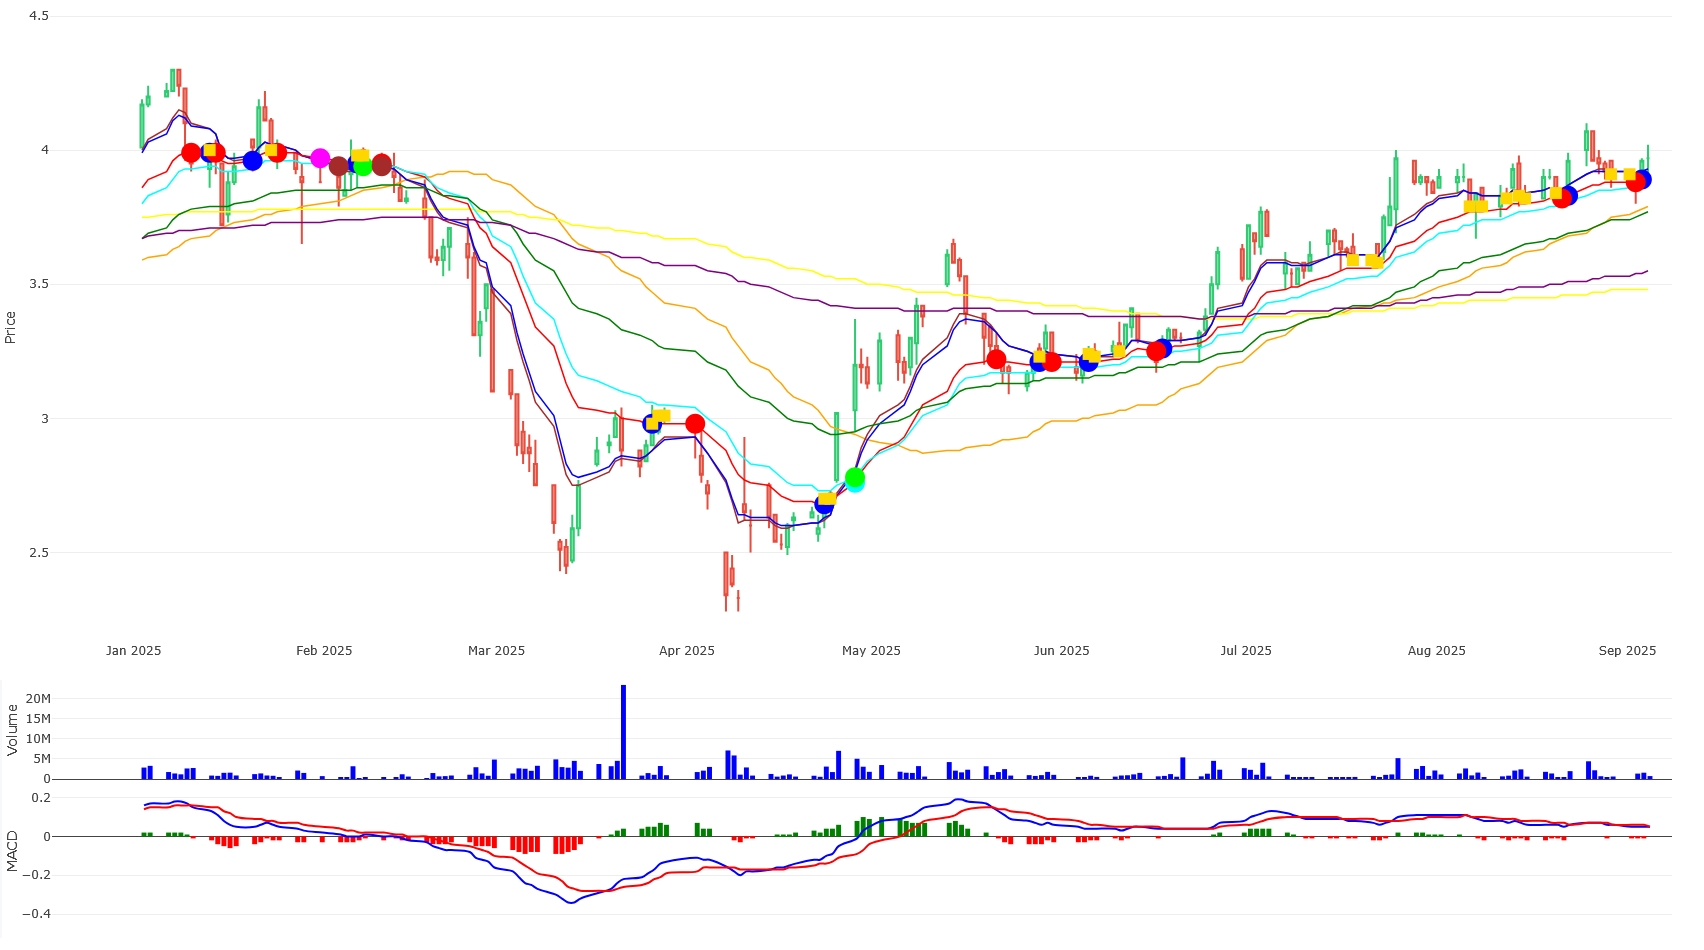
- The rally continues into 2025, peaking at RM 4.22 in early January.
- The RSI was again over 70, giving a warning.
- The trend then reverses into a severe downtrend, crashing all the way down to RM 2.34 by April 2025.
- It attempts a recovery but, as of the last data point (4 Sept 2025), is trading at RM 3.97.
- The RSI is at 57.79 (neutral) and the MACD is positive but very weak. The trend from the April low is up, but it’s still well below its January highs.
Summary: How to Decide Based on This Data
This analysis highlights a critical lesson: Not all price increases are healthy breakouts.
- Parabolic Spike (Jun 2024): A vertical, high-volume price explosion to extreme highs. This is a SELL signal, not a BUY signal. It is unsustainable. Crucially, the EMA10 crosses back above the EMA50 around June 10, 2024 (EMA10 ~RM 4.12, EMA50 ~RM 3.86). This is a “Golden Cross” and a classic buy signal. However, context is key. The move is too fast and parabolic. The price rockets far above the EMA10, which is a sign of being overextended.
- Healthy Breakout (Dec 2024): A move above a key resistance level on increased volume, following a period of consolidation. This is a potential BUY signal.
The ability to distinguish between reckless speculation (the spike) and a sustainable trend change (the breakout) is a fundamental skill in technical analysis.
- To BUY: You want to see:
- The price is in an uptrend (making higher highs and higher lows).
- The price is pulling back towards a support level or breaking out above resistance.
- Volume is high on the upward moves.
- MACD has given a bullish crossover (like in June 2024).
- RSI is preferably below 70 (not overbought) or coming out of oversold (<30) conditions during an uptrend.
- To SELL (or Avoid Buying): You see the opposite:
- The price is in a downtrend (making lower lows and lower highs).
- The price is failing at a resistance level.
- Volume is high on the downward moves.
- MACD has given a bearish crossover.
- RSI is above 70 (overbought), especially after a long run-up.
How to Start Practicing Today (Without Risking a Dime)
- Open a Paper Trading Account: Most major brokerage platforms (like Maybank Invest, Rakuten Trade) offer free paper trading or demo accounts. You get fake money to trade with in real markets. This is the #1 best way to learn. Practice identifying trends, support, and resistance.
- Keep a Trading Journal: When you look at a chart, write down what you see. “The price is approaching the support at RM 3.80, volume is rising, and RSI is 35.” Then, see what happens. This connects your analysis to the outcome.
- Start Simple: Pick one or two large, well-known companies and just watch their charts every day.
- Consume Content Wisely: Follow reputable educational sources. Look for content that focuses on teaching concepts, not giving “hot stock tips.”
Word of Advice
Technical analysis is a skill, and like any skill, it takes time and practice to develop. You will make mistakes—everyone does. The goal is not to be right every time, but to be disciplined and manage your risk.
Start small, be patient with yourself, and use your paper trading account to build confidence. Welcome to the markets