
Inari has experienced a dramatic “boom and bust” cycle over the last ~5.5 years. After a spectacular bull run from the COVID lows to a new all-time high in mid-2024, the stock has undergone a severe correction, erasing nearly all of those gains and returning to its 2020 price levels. The current market health is poor and bearish in the short to medium term, with indicators suggesting the sell-off may be overdone, but no clear reversal signal is present yet.
Key Market Metrics (as of August 22, 2025)
- Closing Price: RM 1.92 per share.
- Market Capitalization: RM 7.27 billion (down approx. 37–42% year-on-year)
- Price Range on August 22: Opened around RM 1.91; intraday ranged between RM 1.91 and RM 1.910 (some sources show 1.86–1.92)
- Year-to-Date (YTD) Performance: Down approximately 37.25%
- 12-Month Change: Down roughly 42.7%
Overview & Commentary
- The closing price on 22 August 2025 stands at RM 1.92, representing a notable dip from earlier highs in 2024.
- Market cap has shrunk significantly compared to the end of 2024, reflecting investor concerns amid structural and market pressures.
- These declines align with broader challenges such as softer demand in optoelectronics, margin pressures, and geopolitical uncertainties.
Snapshot Table
| Metric | Value (as of 22 Aug 2025) |
|---|---|
| Closing Price | RM 1.92 |
| Opening Price | ~RM 1.91 |
| Intraday Range | Approximately RM 1.86 – 1.92 |
| Market Cap | RM 7.27 billion |
| YTD Change | −37.3% |
| 12-Month Change | −42.7% |
| 52-Week Range | RM 1.42 – RM 3.45 |
What This Means
- The stock is trading significantly below prior peaks, indicating a period of correction or consolidation.
- A market cap decline of ~37–43% year-over-year reflects a mix of earnings pressure, sector sentiment, and broader risk aversion.
- Technically and sentiment-wise, this may suggest a cautious approach—especially if you’re relying on short-term momentum.
- At the current level, valuation metrics like P/E (over 30x) and dividend yield (~3%) may appeal to long-term investors if they believe in a recovery driven by RF, AI, or capacity expansions—but near-term risks remain elevated.
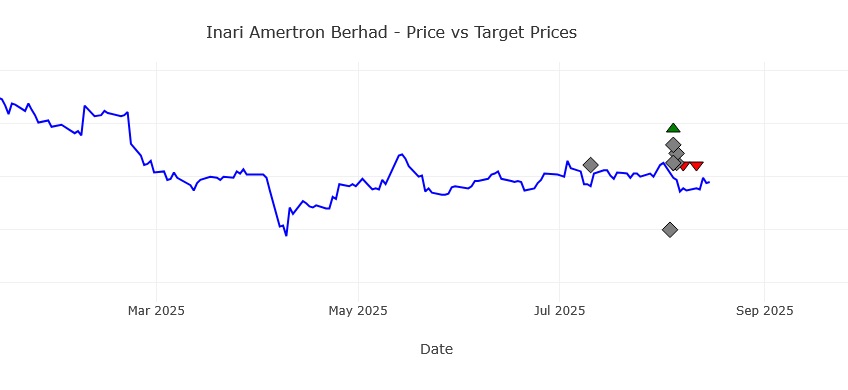
Analyst Price Target Snapshot
| Metric | Value |
| Consensus Target Price | RM 2.17 – RM 2.22 |
| Upside Potential | ~13–14% from RM 1.92 current share price |
| Low–High Target Range | RM 1.50 – RM 3.00 |
Interpretation
- Conservative to moderate upside expectations from analysts—most see room to rise but not a runaway rally.
- Upside (~13–14%) could appeal to long-term investors if company fundamentals improve.
- However, key downside risks remain:
- Near-term uncertainty from tariff environment and demand softness.
- Customer concentration and margin pressure.
- No significant upgrades post-loss revision in recent months.
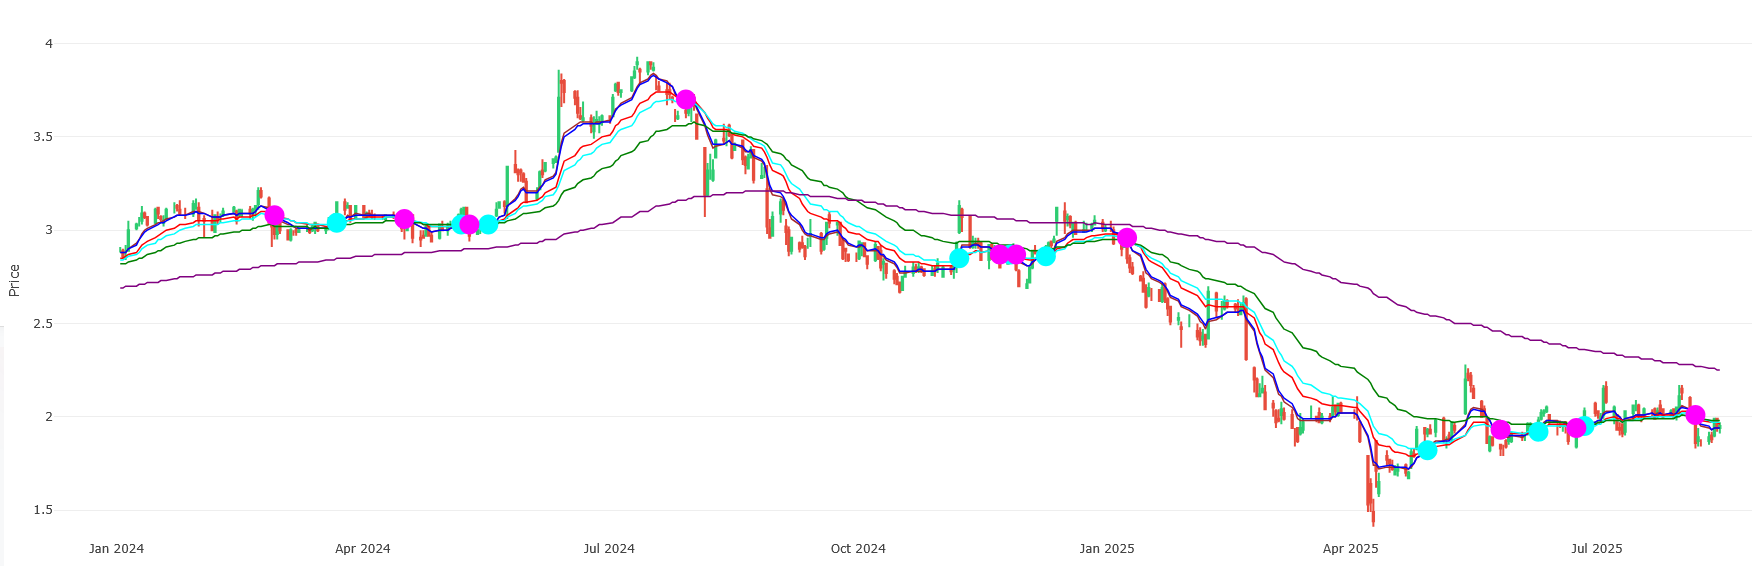
1. Price Trend Analysis & Key Levels
- Long-Term Trend (Jan 2020 – Present): The overall trend is neutral to negative. The stock is up ~29% from its starting point but down over -50% from its all-time high of $3.91 (Jul 12, 2024).
- Medium-Term Trend (Since Jul 2024 Peak): Strongly Bearish. The chart shows a series of lower highs and lower lows.
- Support Levels:
- Critical Support: ~$1.44 (March 2025 low). A break below this level could trigger a new wave of selling.
- Immediate Support: The current area around $1.90 – $1.92 is being tested.
- Resistance Levels:
- Immediate Resistance: $2.00 – $2.03. The price must reclaim and hold above this level to suggest any short-term strength.
- Strong Resistance: ~$2.20 and the $2.50 level.
2. Volume Analysis
- Bull Run Volume: The rally from 2020-2024 was accompanied by consistently high and often rising volume, confirming institutional and strong retail buying interest.
- Recent Volume (Bearish Signal): The decline from the peak has featured extremely high volume on down days (e.g., 61.2M on Aug 1, 2024). This is a classic sign of capitulation – a panic-driven sell-off where shareholders dump their holdings.
- Current Reading (Aug 22, 2025): Volume of 14.8M on a down day is still elevated, indicating selling pressure is still present, though not at peak panic levels.
3. Momentum Indicators (RSI & MACD)
- RSI (Relative Strength Index):
- Current Value: 45.92 (Neutral).
- Analysis: The RSI recently emerged from deeply oversold conditions (below 30), which it hit during the worst of the sell-off. This suggests the most intense selling pressure has likely exhausted itself. However, it is still below 50, indicating bearish momentum is still in control. A move above 50 would be the first sign of momentum shifting.
- MACD (Moving Average Convergence Divergence):
- Current Value: -0.0195 (Bearish).
- Analysis: The MACD line is below the signal line (negative histogram), which is a clear confirmation of the ongoing downtrend. This is one of the strongest bearish signals on the chart. For a bullish reversal to be signaled, we would need to see the MACD line cross above the signal line (a bullish crossover).
4. Market Sentiment & Risk Assessment
- Sentiment: Extremely Negative. The violent price decline and high-volume capitulation reflect a massive shift in sentiment from euphoria to fear and pessimism.
- Risk Level: HIGH. The trend is firmly down, and the stock is in a clear bear market. Catching a “falling knife” is a significant risk.
- Volatility: VERY HIGH. The stock has proven to be highly volatile, capable of both massive gains and severe losses. This suits aggressive traders but is risky for conservative investors.
Synthesis & Conclusion: What to Look For Next
The data paints a picture of a stock that has experienced a catastrophic collapse from its peak. While the crash may have created a potential long-term opportunity, the burden of proof is on the bulls.
- For Existing Holders: The current position is challenging. The intense selling appears to have paused, but there is no recovery sign yet. Any decision should be based on your original investment thesis and risk tolerance.
- For Potential Buyers: This is a high-risk situation. Entering now is speculative.
Adopt a “Wait and See” approach. Look for these CONFIRMATION SIGNALS before considering a bullish position:
- Price Action: A sustained break and close above $2.03, followed by a break above $2.20.
- MACD: A bullish crossover where the MACD line crosses above its signal line. This is crucial.
- RSI: A sustained move above the 50 level.
- Volume: Any potential rally should be supported by increasing volume to confirm new buying interest is real.
The Bottom Line: Inari’s chart is currently bearish. All major indicators support this view. While the stock is no longer in extreme oversold panic, it has not yet shown any credible signs of a bottom or reversal. The path of least resistance remains down until proven otherwise. Prudent investors should wait for the technical picture to improve significantly before committing capital.
Disclaimer: This analysis is based solely on the provided historical price and indicator data. It is for informational purposes only and should not be considered as financial advice. Always conduct your own research and consider your risk tolerance before making any investment decisions.