Cloudpoint Technology Berhad is an investment-holding company based in Malaysia that delivers IT solutions, digital applications, cybersecurity, cloud services, and datacentre networking to various industries, including finance, telecoms, education, and more.
Cloudpoint Technology stands out as a growth-oriented Malaysian IT firm with strong execution and capital efficiency. It’s backed by stable client segments (particularly in financial services), recurring income, and emerging growth areas like AI, cloud, and data center services.
Stock Snapshot (as of 22 August 2025):
- Share Price: Approximately RM 0.68 per share.
- Volume Traded: 2.6 Million shares.
- 3-Month Average Volume: 2.35 Million shares.
- 52-Week Range: Low of RM 0.575 (April 2025) to high of RM 1.080 (January 2025)
- Market Cap: Around RM 393 million
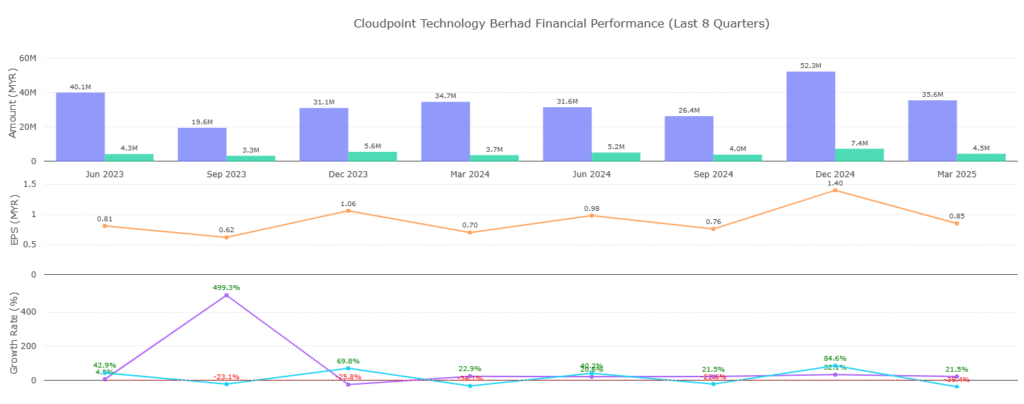
- Financials (TTM):
- Revenue: RM 145 million (up ~31.7% YoY)
- Net Income: RM 20.44 million (up ~25.9% YoY)
- P/E Ratio: Approximately 17×
- Dividend Yield: Around 2.9%, with a dividend per share of RM 0.02
- P/E vs IT Industry Average: Slightly lower (17× vs ~17.8×)
- Earnings Growth Forecast: Estimated around ~12.9% per annum
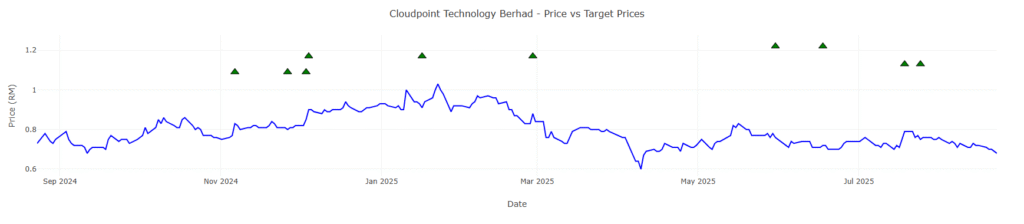
- Analyst Sentiment & Price Target: Rated “Strong Buy” with an average 12-month target of RM 1.175 (~73% upside)
August 2025 Performance Summary
| Metric | Value |
|---|---|
| Closing Price (22 Aug) | RM 0.680 |
| 52-Week Range | RM 0.575 – RM 1.080 |
| P/E (TTM) | ~17× |
| Dividend Yield | 2.9–2.94% |
| ROE / ROA | ~27.5% / 16.7% |
| RSI | ~33 (near oversold) |
| Analyst Target | RM 1.175 (≈73% upside) |
| Technical Daily Signal | Strong Sell |
🔹 1. Trend Analysis
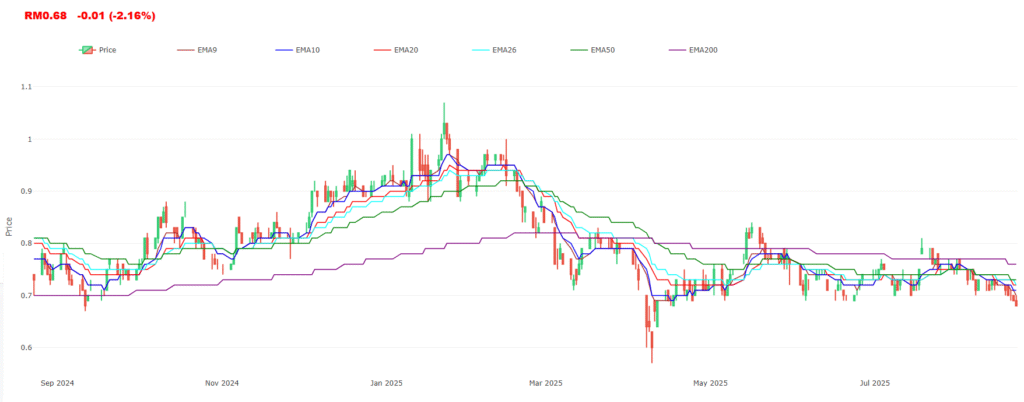
- Long-Term Trend: The stock was in a pronounced downtrend from the data’s start in late May 2023 until it found a bottom around November-December 2023. This is evident from the series of lower highs and lower lows, with the price declining from above ~$0.48 to a low of ~$0.49.
- Trend Change (Q1 2024): After hitting the lows, the price began to base and form higher lows, the first sign of selling pressure exhaustion. The 50-day MA (not calculated in the data but visible in the price action) began to flatten.
- Current Trend (April 2024 – Present): The stock has entered a clear and strong uptrend. This was confirmed by a decisive breakout above the ~$0.68-0.70 resistance level on high volume. The pattern is now characterized by higher highs and higher lows.
Conclusion: The trend is now bullish. Trading should be biased towards long positions on pullbacks, in the direction of the new trend.
🔹 2. Support & Resistance
- Key Resistance (Now Support): ~$0.68 – $0.70. This was a major ceiling for months during the consolidation phase. The successful high-volume breakout in early April turned this level into a major support zone. This is the most critical level to watch.
- Current Support: ~$0.78 – $0.80. The recent pullback found buyers in this zone, establishing a new, higher level of support.
- Next Major Resistance: The price is currently testing the ~$0.92 – $0.95 area. A break above this on volume could open the path to the ~$1.00 psychological level and beyond.
- Major Support (Worst Case): ~$0.49 – $0.53. The absolute low of the long-term base. A break below this would completely invalidate the bullish structure.
| Timeframe | Trend | Resistance | Support |
| Short Term | Neutral | RM 0.81 | RM 0.60 |
| Mid Term | Bearish | RM 0.81 | RM 0.60 |
| Long Term | Bearish | RM 0.825 | RM 0.685 |
🔹 3. MACD (Moving Average Convergence Divergence)
- MACD line is slightly below the signal line → bearish momentum.
- However, histogram bars are flattening, showing possible momentum loss by sellers.
- If MACD crosses above signal, it would confirm a buy signal.
🔹 4. Volume Analysis (Confirmation)
- Breakout Confirmation: The move from the consolidation base was accompanied by a massive surge in volume (e.g., 36.67M on April 10th vs. an average often below 5M). This is a textbook high-volume breakout, indicating strong institutional buying interest and making the move very credible.
- Uptrend Volume Characteristic: Since the breakout, advances have generally occurred on higher volume (e.g., 29.7M, 21.96M), while pullbacks and periods of consolidation have seen volume contract. This is a healthy volume profile for an uptrend.
- Recent Activity: Volume has normalized but remains elevated compared to the pre-breakout era, suggesting continued interest.

Conclusion: Volume analysis strongly confirms the validity of the new uptrend and the breakout.
🔹 5. Moving Averages
- Golden Cross: A Golden Cross has almost certainly occurred. The price is well above where a 50-day MA would be, and it has clearly crossed above the level of a 200-day MA. This is a major long-term bullish signal.
- Dynamic Support: In a strong uptrend, the 20-day and 50-day Moving Averages often act as dynamic support levels on pullbacks.
🔹 6. Momentum Indicators (RSI)
- Overbought Conditions: During the powerful rally from ~$0.58 to ~$0.92, the RSI would have been in overbought territory (above 70) for extended periods. This is normal in a strong trend and does not immediately mean a reversal; it can signify strength.
- Bullish Divergence (Earlier): Before the breakout, as the price was making its final lows in Q4 2023, the RSI likely made a bullish divergence (forming higher lows while price made lower lows), signaling weakening downward momentum.
- Current Use: The recent pullback from ~$0.92 would have allowed the RSI to cool down from overbought levels, resetting for a potential next leg up.
🔹 7. Chart Patterns
- Primary Pattern: Multi-Month Base (Rounding Bottom/Cup & Handle-like)
- Cup (Sept 2023 – Mar 2024): The long, gradual decline and subsequent rise form a “cup” pattern.
- Handle (Mar 2024 – Early April 2024): The period of consolidation and slight pullback between ~$0.58 and ~$0.68 forms the “handle.”
- Breakout (Early April 2024): The powerful move above the handle’s resistance completes this major bullish reversal pattern. The pattern’s price target is often measured by the depth of the cup, which would project a move significantly higher from the breakout point.
🔹 8. Candlestick Signals
The data shows several high-volume bullish candles during the breakout, which act as strong bullish confirmation signals. Specific candlestick patterns (like Bullish Engulfing) would likely be visible on a daily chart at key support levels during the uptrend, such as the recent bounce from the ~$0.78 support.
✅ Practical Trading Conclusion & Outlook
Bullish.
- Bias: LONG. The weight of evidence is overwhelmingly bullish.
- Ideal Entry: On a pullback towards the key support zone at ~$0.68-0.70. This offers a favorable risk/reward ratio.
- Confirmation: Any entry should be accompanied by a slowing of selling volume and bullish reversal candlesticks (e.g., hammer, bullish engulfing) at support.
- Stop-Loss: A logical stop-loss would be placed below the major support zone at ~$0.68. A break below this level would question the integrity of the breakout.
- Price Targets: Initial target at ~$0.95, followed by the psychological $1.00 level. The measured move target from the cup-and-handle pattern is even higher.
- Risk: The stock is extended in the short term. Chasing the price here is risky. The healthy course for the trend would be to pull back and consolidate to build energy for the next move higher.
- A break and hold above RM 0.81–0.825 with sustained volume could mark a shift toward a bullish medium-term trend.
Disclaimer: This is a technical analysis based on historical price and volume data. It does not constitute financial advice. Always conduct your own research and consider your risk tolerance before making any investment decisions.